Let's start with some best practices for a good autocomplete input:

-
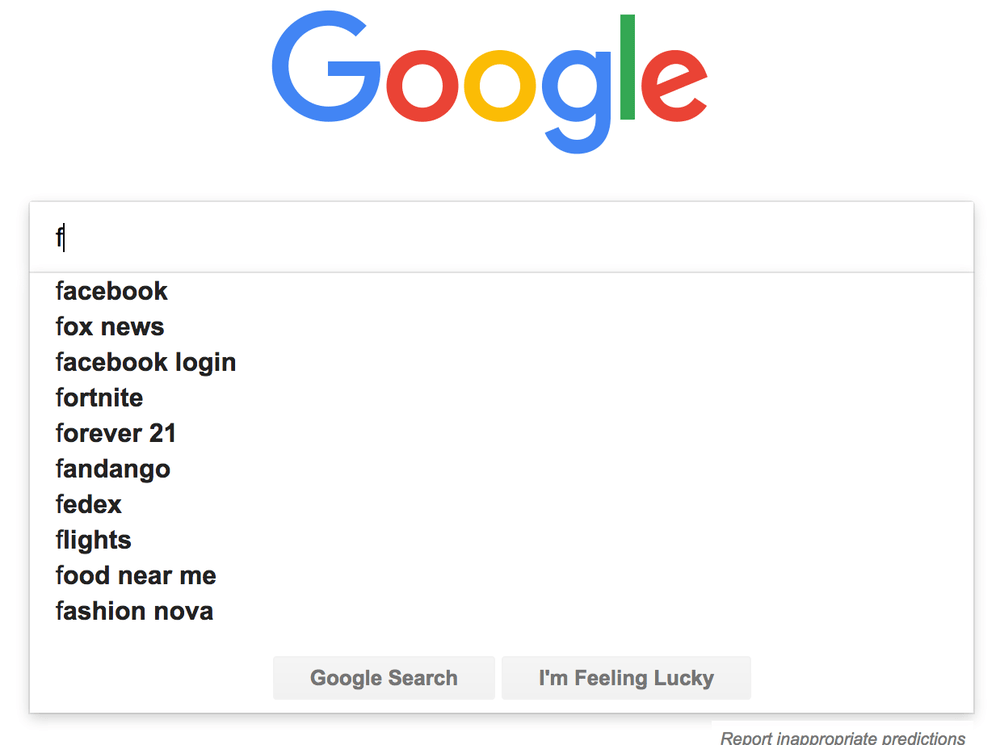
You want to start suggesting something as soon user starts typing. Apparently the most common search term on Google is f because people type that and Google's autocomplete starts suggesting Facebook (www.facebook.com).
-
If your autocomplete depends on a list of suggestions that is huge, such that you can't have all possible options preloaded in memory in JavaScript, starting a XHR request for every single input is not feasible. You have to throttle the XHR network requests.
-
Since networks are unreliable and results come back asynchronously in a possible different order from when they started, you should only populate your autocomplete list based on the latest XHR request.
-
If people type a lot in and keep ignoring autocomplete suggestions, you can calm your suggestions.
-
Unless you're Google or Amazon.com it might not make sense to suggest new words to autocomplete if what's been typed previously is not going to yield any results anyway. I.e. User's typed "Xjhfgxx1m 8cxxvkaspty efx8cnxq45jn Pet", there's often little value in suggesting "Peter" for that later term you're typing.
-
Users don't necessarily type one character at a time. On mobile, you might have some sort of autocomplete functionality with the device's keyboard. Bear that in mind.
-
You should not have to make an XHR request for the same input as done before. I.e. user types "f" then types in "fa" then backspaces so it's back to "f" again. This should only be at most 2 lookups.
To demonstrate these best practises, I'm going to use React with a mocked-out network request and mocked out UI for actual drop-down of options that usually appears underneath the input widget.
The Most Basic Version
In this version we have an event listener on every onChange and send the value of the input to the autocomplete function (called _fetch in this example):
class App extends React.Component {
  state = { q: "" };

  changeQuery = event => {
    this.setState({ q: event.target.value }, () => {
      this.autocompleteSearch();
    });
  };

  autocompleteSearch = () => {
    this._fetch(this.state.q);
  };

  _fetch = q => {
    const _searches = this.state._searches || [];
    _searches.push(q);
    this.setState({ _searches });
  };

  render() {
    const _searches = this.state._searches || [];
    return (
      <div>
        <input
          placeholder="Type something here"
          type="text"
          value={this.state.q}
          onChange={this.changeQuery}
        />
        <hr />
        <ol>
          {_searches.map((s, i) => {
            return <li key={s + i}>{s}</li>;
          })}
        </ol>
      </div>
    );
  }
}
You can try it here: No Throttle or Debounce
Note, when use it that an autocomplete lookup is done for every single change to the input (characters typed in or whole words pasted in). Typing in "Alask" at a normal speed our make an autocomplete lookup for "a", "al", "ala", "alas", and "alask".
Also worth pointing out, if you're on a CPU limited device, even if the autocomplete lookups can be done without network requests (e.g. you have a local "database" in-memory) there's still expensive DOM updates for that needs to be done for every single character/word typed in.
Throttled
What a throttle does is that it triggers predictably after a certain time. Every time. Basically, it prevents excessive or repeated calling of another function but doesn't get reset.
So if you type "t h r o t t l e" at a speed of 1 key press per 500ms the whole thing will take 8x500ms=3s and if you have a throttle on that, with a delay of 1s, it will fire 4 times.
I highly recommend using throttle-debounce to actually do the debounce. Let's rewrite our demo to use debounce:
import { throttle } from "throttle-debounce";

class App extends React.Component {
  constructor(props) {
    super(props);
    this.state = { q: "" };
    this.autocompleteSearchThrottled = throttle(500, this.autocompleteSearch);
  }

  changeQuery = event => {
    this.setState({ q: event.target.value }, () => {
      this.autocompleteSearchThrottled(this.state.q);
    });
  };

  autocompleteSearch = q => {
    this._fetch(q);
  };

  _fetch = q => {
    const _searches = this.state._searches || [];
    _searches.push(q);
    this.setState({ _searches });
  };

  render() {
    const _searches = this.state._searches || [];
    return (
      <div>
        <h2>Throttle</h2>
        <p>½ second Throttle triggering the autocomplete on every input.</p>
        <input
          placeholder="Type something here"
          type="text"
          value={this.state.q}
          onChange={this.changeQuery}
        />
        <hr />
        {_searches.length ? (
          <button
            type="button"
            onClick={event => this.setState({ _searches: [] })}
          >
            Reset
          </button>
        ) : null}
        <ol>
          {_searches.map((s, i) => {
            return <li key={s + i}>{s}</li>;
          })}
        </ol>
      </div>
    );
  }
}
One thing to notice on the React side is that the autocompleteSearch method can no longer use this.state.q because the function gets executed by the throttle function so the this is different. That's why, in this version we pass the search term as an argument instead.
You can try it here: Throttle
If you type something reasonably fast you'll notice it fires a couple of times. It's quite possible that if you type a bunch of stuff, with your eyes on the keyboard, by the time you're done you'll see it made a bunch of (mocked) autocomplete lookups whilst you weren't paying attention. You should also notice that it fired on the very first character you typed.
A cool feature about this is that if you can afford the network lookups, the interface will feel snappy. Hopefully, if your server is fast to respond to the autocomplete lookups there are quickly some suggestions there. At least it's a great indicator that the autocomplete UX is a think the user can expect as she types more.
Debounce
An alternative approach is to use a debounce. From the documentation of throttle-debounce:
"Debouncing, unlike throttling, guarantees that a function is only executed a single time, either at the very beginning of a series of calls, or at the very end."
Basically, ever time you "pile something on" it discards all the other delayed executions. Changing to this version is easy. just change import { throttle } from "throttle-debounce"; to import { debounce } from "throttle-debounce"; and change this.autocompleteSearchThrottled = throttle(1000, this.autocompleteSearch); to this.autocompleteSearchDebounced = debounce(1000, this.autocompleteSearch);
Here is the debounce version:
import { debounce } from "throttle-debounce";

class App extends React.Component {
  constructor(props) {
    super(props);
    this.state = { q: "" };
    this.autocompleteSearchDebounced = debounce(500, this.autocompleteSearch);
  }

  changeQuery = event => {
    this.setState({ q: event.target.value }, () => {
      this.autocompleteSearchDebounced(this.state.q);
    });
  };

  autocompleteSearch = q => {
    this._fetch(q);
  };

  _fetch = q => {
    const _searches = this.state._searches || [];
    _searches.push(q);
    this.setState({ _searches });
  };

  render() {
    const _searches = this.state._searches || [];
    return (
      <div>
        <h2>Debounce</h2>
        <p>
          ½ second Debounce triggering the autocomplete on every input.
        </p>
        <input
          placeholder="Type something here"
          type="text"
          value={this.state.q}
          onChange={this.changeQuery}
        />
        <hr />
        {_searches.length ? (
          <button
            type="button"
            onClick={event => this.setState({ _searches: [] })}
          >
            Reset
          </button>
        ) : null}
        <ol>
          {_searches.map((s, i) => {
            return <li key={s + i}>{s}</li>;
          })}
        </ol>
      </div>
    );
  }
}
You can try it here: Throttle
If you try it you'll notice that if you type at a steady pace (under 1 second for each input), it won't really trigger any autocomplete lookups at all. It basically triggers when you take your hands off the keyboard. But the silver lining with this approach is that if you typed "This is my long search input" it didn't bother looking things up for "this i", "this is my l", "this is my long s", "this is my long sear", "this is my long search in" since they are probably not very useful.
Best of Both World; Throttle and Debounce
The throttle works great in the beginning when you want the autocomplete widget to seem eager but if the user starts typing in a lot, you'll want to be more patient. It's quite human. If a friend is trying to remember something you're probably at first really quick to try to help with suggestions, but once you friend starts to remember and can start reciting, you patiently wait a bit more till they have said what they're going to say.
In this version we're going to use throttle (the eager one) in the beginning when the input is short and debounce (the patient one) when user has ignored the first autocomplete inputs and starting typing something longer.
Here is the version that uses both:
import { throttle, debounce } from "throttle-debounce";

class App extends React.Component {
  constructor(props) {
    super(props);
    this.state = { q: ""};
    this.autocompleteSearchDebounced = debounce(500, this.autocompleteSearch);
    this.autocompleteSearchThrottled = throttle(500, this.autocompleteSearch);
  }

  changeQuery = event => {
    this.setState({ q: event.target.value }, () => {
      const q = this.state.q;
      if (q.length < 5) {
        this.autocompleteSearchThrottled(this.state.q);
      } else {
        this.autocompleteSearchDebounced(this.state.q);
      }
    });
  };

  autocompleteSearch = q => {
    this._fetch(q);
  };

  _fetch = q => {
    const _searches = this.state._searches || [];
    _searches.push(q);
    this.setState({ _searches });
  };

  render() {
    const _searches = this.state._searches || [];
    return (
      <div>
        <h2>Throttle and Debounce</h2>
        <p>
          ½ second Throttle when input is small and ½ second Debounce when
          the input is longer.
        </p>
        <input
          placeholder="Type something here"
          type="text"
          value={this.state.q}
          onChange={this.changeQuery}
        />
        <hr />
        {_searches.length ? (
          <button
            type="button"
            onClick={event => this.setState({ _searches: [] })}
          >
            Reset
          </button>
        ) : null}
        <ol>
          {_searches.map((s, i) => {
            return <li key={s + i}>{s}</li>;
          })}
        </ol>
      </div>
    );
  }
}
In this version I cheated a little bit. The delays are different. The throttle has a delay of 500ms and the debounce as a delay of 1000ms. That makes it feel little bit more snappy there in the beginning when you start typing but once you've typed more than 5 characters, it switches to the more patient debounce version.
You can try it here: Throttle and Debounce
With this version, if you, in a steady pace typed in "south carolina" you'd notice that it does autocomplete lookups for "s", "sout" and "south carolina".
Avoiding wrongly ordered async responses
Suppose the user slowly types in "p" then "pe" then "pet", it would trigger 3 XHR requests. I.e. something like this:
fetch('/autocomplete?q=p')

fetch('/autocomplete?q=pe')

fetch('/autocomplete?q=pet')
But because all of these are asynchronous and sometimes there's unpredictable slowdowns on the network, it's not guarantee that they'll all come back in the same exact order. The solution to this is to use a "global variable" of the latest search term and then compare that to the locally scoped search term in each fetch callback promise. That might sound harder than it is. The solution basically looks like this:
class App extends React.Component {
makeAutocompleteLookup = q => {
this.waitingFor = q;
fetch('/autocompletelookup?q=' + q)
.then(response => {
if (response.status === 200) {
if (q === this.waitingFor) {
response.json()
.then(results => {
this.setState({results: results});
})
}
}
})
}
}
Bonus feature; Caching
For caching the XHR requests, to avoid unnecessary network requests if the user uses backspace, the simplest solution is to maintain a dictionary of previous results as a component level instance. Let's assume you do the XHR autocomplete lookup like this initially:
class App extends React.Component {

  makeAutocompleteLookup = q => {
    const url = '/autocompletelookup?q=' + q;
    fetch(url)
    .then(response => {
      if (response.status === 200) {
        response.json()
        .then(results => {
            this.setState({ results });
        })
      }
    })
  }

}
To add caching (also a form of memoization) you can simply do this:
class App extends React.Component {

  _autocompleteCache = {};

  makeAutocompleteLookup = q => {
    const url = '/autocompletelookup?q=' + q;

    const cached = this._autocompleteCache[url];
    if (cached) {
      return Promise.resolve(cached).then(results => {
        this.setState({ results });
        });
      });
    }

    fetch(url)
    .then(response => {
      if (response.status === 200) {
        response.json()
        .then(results => {
            this.setState({ results });
        })
      }
    })
  }

}
In a more real app you might want to make that whole method always return a promise. And you might want to do something slightly smarter when response.status !== 200.
Bonus feature; Watch out for spaces
So the general gist of these above versions is that you debounce the XHR autocomplete lookups to only trigger sometimes. For short strings we trigger every, say, 300ms. When the input is longer, we only trigger when it appears the user has stopped typing. A more "advanced" approach is to trigger after a space. If I type "south carolina is a state" it's hard for a computer to know if "is", "a", or "state" is a complete word. Humans know and some English words can easily be recognized as stop words. However, what you can do is take advantage of the fact that a space almost always means the previous word was complete. It would be nice to trigger an autocomplete lookup after "south carolina" and "south carolina is" and "south carolina is a". These are also easier to deal with on the server side because, depending on your back-end, it's easier to search your database if you don't include "broken" words like "south carolina is a sta". To do that, here's one such implementation:
class App extends React.Component {
changeQuery = event => {
const q = event.target.value
this.setState({ q }, () => {
if (q.length < 5 || q.endsWith(' ')) {
this.autocompleteSearchThrottled(q);
} else {
this.autocompleteSearchDebounced(q);
}
});
};
}
You can try it here: Throttle and Debounce with throttle on ending spaces.
Next level stuff
There is so much more that you can do for that ideal user experience. A lot depends on the context.
For example, when the input is small instead of doing a search on titles or names or whatever, you instead return a list of possible full search terms. So, if I have typed "sou" the back-end could return things like:
{
  "matches": [
     {"term": "South Carolina", "count": 123},
     {"term": "Southern", "count": 469},
     {"term": "South Dakota", "count": 98},
  ]
}
If the user selects one of these autocomplete suggestions, instead of triggering a full search you just append the selected match back into the search input widget. This is what Google does.
And if the input is longer you go ahead and actually search for the full documents. So if the input was "south caro" you return something like this:
{
  "matches": [
     {
       "title": "South Carolina Is A State",
       "url": "/permapage/x19v093d"
     },
     {
       "title": "Best of South Carolina Parks",
       "url": "/permapage/9vqif3z"
     },
     {
       "title": "I Live In South Carolina",
       "url": "/permapage/abc300a1y"
     },
  ]
}
And when the XHR completes you look at what the user clicked and do something like this:
  return (<ul className="autocomplete">
    {this.state.results.map(result => {
      return <li onClick={event => {
        if (result.url) {
          document.location.href = result.url;
        } else {
          this.setState({ q: result.term });
        }
      }}>
        {result.url ? (
          <p className="document">{result.title}</p>
        ) : (
            <p className="new-term">{result.term}</p>
          )}
      </li>
    })
    }
    </ul>
  )
This is an incomplete example and more pseudo-code than a real solution but the pattern is quite nice. You're either helping the user type the full search term or if it's already a good match you can go skip the actual searching and go to the result directly.
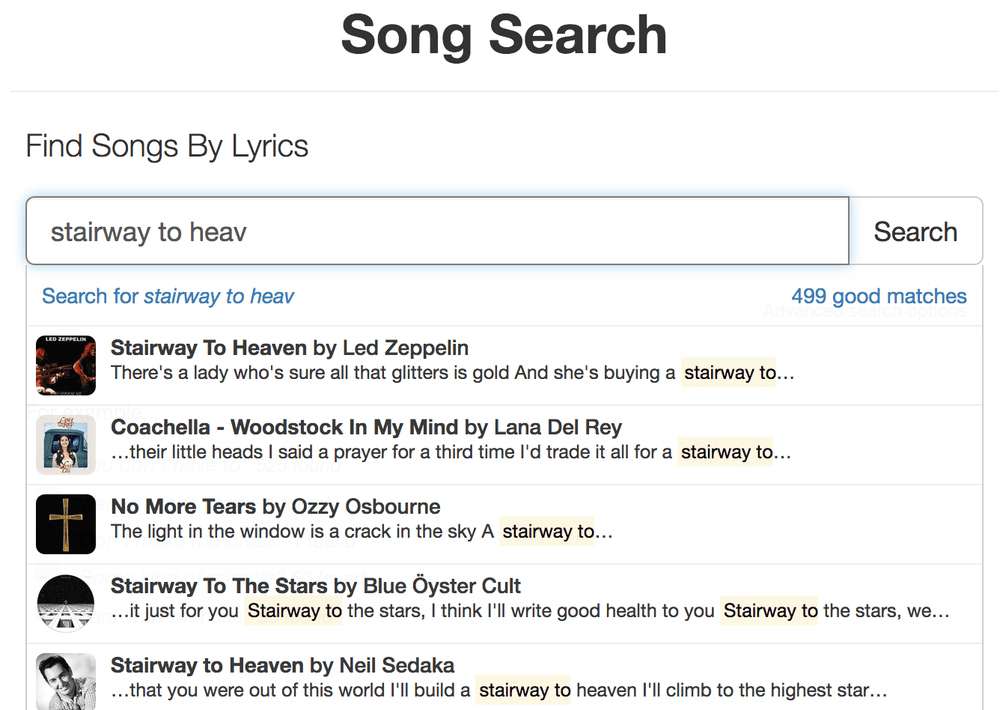
This is how SongSearch works for example:
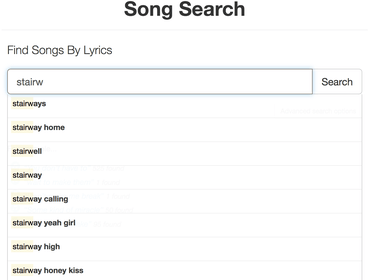
Suggestions for full search terms
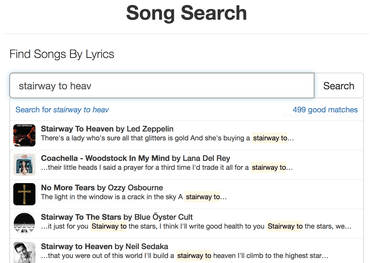
Suggestions for actual documents