Filtered by Python

Page 9

Reset

Concurrent Gzip in Python

October 13, 2017
11 comments Python, Linux, Docker

Suppose you have a bunch of files you need to Gzip in Python; what's the optimal way to do that? In serial, to avoid saturating the GIL? In multiprocessing, to spread the load across CPU cores? Or with threads?

I needed to know this for symbols.mozilla.org since it does a lot of Gzip'ing. In symbols.mozilla.org clients upload a zip file full of files. A lot of them are plain text and when uploaded to S3 it's best to store them gzipped. Basically it does this:


def upload_sym_file(s3_client, payload, bucket_name, key_name):
    file_buffer = BytesIO()
    with gzip.GzipFile(fileobj=file_buffer, mode='w') as f:
        f.write(payload)
    file_buffer.seek(0, os.SEEK_END)
    size = file_buffer.tell()
    file_buffer.seek(0)
    s3_client.put_object(
        Bucket=bucket_name,
        Key=key_name,
        Body=file_buffer
    )
    print(f"Uploaded {size}")

Another important thing to consider before jumping into the benchmark is to appreciate the context of this application; the bundles of files I need to gzip are often many but smallish. The average file size of the files that need to be gzip'ed is ~300KB. And each bundle is between 5 to 25 files.

The Benchmark

For the sake of the benchmark, here, all it does it figure out the size of each gzipped buffer and reports that as a list.

f1 - Basic serial


def f1(payloads):
    sizes = []
    for payload in payloads:
        sizes.append(_get_size(payload))
    return sizes

f2 - Using multiprocessing.Pool


def f2(payloads):  # multiprocessing
    sizes = []
    with multiprocessing.Pool() as p:
        sizes = p.map(_get_size, payloads)
    return sizes

f3 - Using concurrent.futures.ThreadPoolExecutor


def f3(payloads):  # concurrent.futures.ThreadPoolExecutor
    sizes = []
    futures = []
    with concurrent.futures.ThreadPoolExecutor() as executor:
        for payload in payloads:
            futures.append(
                executor.submit(
                    _get_size,
                    payload
                )
            )
        for future in concurrent.futures.as_completed(futures):
            sizes.append(future.result())
    return sizes

f4 - Using concurrent.futures.ProcessPoolExecutor


def f4(payloads):  # concurrent.futures.ProcessPoolExecutor
    sizes = []
    futures = []
    with concurrent.futures.ProcessPoolExecutor() as executor:
        for payload in payloads:
            futures.append(
                executor.submit(
                    _get_size,
                    payload
                )
            )
        for future in concurrent.futures.as_completed(futures):
            sizes.append(future.result())
    return sizes

Note that when using asynchronous methods like this, the order of items returned is not the same as they're submitted. An easy remedy if you need the results back in order is to not use a list but to use a dictionary. Then you can track each key (or index if you like) to a value.

The Results

I ran this on three different .zip files of different sizes. To get some sanity in the benchmark I made it print out how many bytes it has to process and how many bytes the gzip will manage to do.

# files 66
Total bytes to gzip 140.69MB
Total bytes gzipped 14.96MB
Total bytes shaved off by gzip 125.73MB

# files 103
Total bytes to gzip 331.57MB
Total bytes gzipped 66.90MB
Total bytes shaved off by gzip 264.67MB

# files 26
Total bytes to gzip 86.91MB
Total bytes gzipped 8.28MB
Total bytes shaved off by gzip 78.63MB

Sorry for being eastetically handicapped when it comes to using Google Docs but here goes...


This demonstrates the median times it takes each function to complete, each of the three different files.

In all three files I tested, clearly doing it serially (f1) is the worst. Supposedly since my laptop has more than one CPU core and the others are not being used. Another pertinent thing to notice is that when the work is really big, (the middle 4 bars) the difference isn't as big doing things serially compared to concurrently.

That second zip file contained a single file that was 80MB. The largest in the other two files were 18MB and 22MB.


This is the mean across all medians grouped by function and each compared to the slowest.

I call this the "bestest graph". It's a combination across all different sizes and basically concludes which one is the best, which clearly is function f3 (the one using concurrent.futures.ThreadPoolExecutor).

CPU Usage

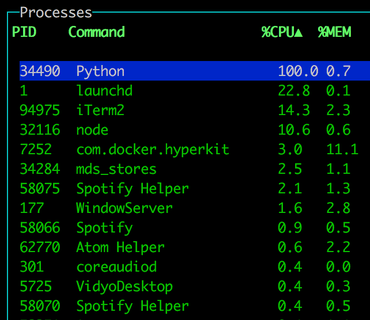
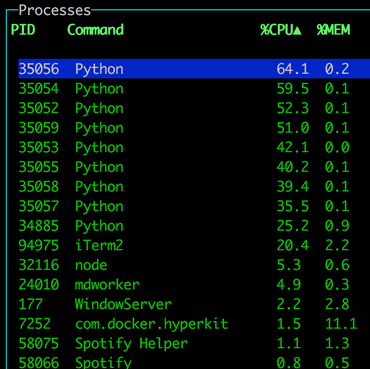
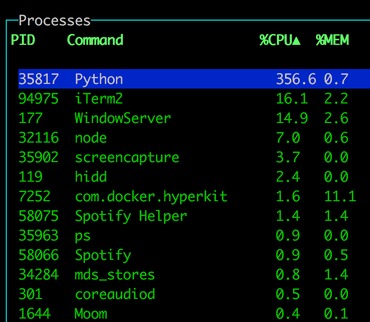
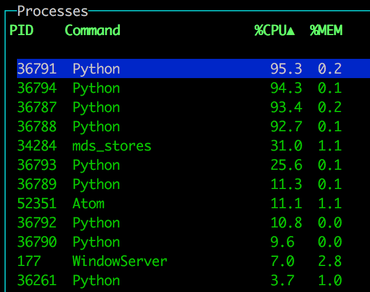
This is probably the best way to explain how the CPU is used; I ran each function repeatedly, then opened gtop and took a screenshot of the list of processes sorted by CPU percentage.

f1 - Serially

f1
No distractions but it takes 100% of one CPU to work.

f2 - multiprocessing.Pool

f2
My laptop has 8 CPU cores, but I don't know why I see 9 Python processes here.
I don't know why each CPU isn't 100% but I guess there's some administrative overhead to start processes by Python.

f3 - concurrent.futures.ThreadPoolExecutor

f3
One process, with roughly 5 x 8 = 40 threads GIL swapping back and forth but all in all it manages to keep itself very busy since threads are lightweight to share data to.

f4 - concurrent.futures.ProcessPoolExecutor

f4
This is actually kinda like multiprocessing.Pool but with a different (arguably easier) API.

Conclusion

By a small margin concurrent.futures.ThreadPoolExecutor won. That's despite not being able to use all CPU cores. This, pseudo scientifically, proves that the overhead of starting the threads is (remember average number of files in each .zip is ~65) more worth it than being able to use all CPUs.

Discussion

There's an interesting twist to this! At least for my use case...

In the application I'm working on, there's actually a lot more that needs to be done other than just gzip'ping some blobs of files. For each file I need to a HEAD query to AWS S3 and an PUT query to AWS S3 too. So what I actually need to do is create an instance of client = botocore.client.S3 that I use to call client.list_objects_v2 and client.put_object.

When you create an instance of botocore.client.S3, automatically botocore will instanciate itself with credentials from os.environ['AWS_ACCESS_KEY_ID'] etc. (or read from some /.aws file). Once created, if you ask it to do many different network operations, internally it relies on urllib3.poolmanager.PoolManager which is a list of 10 HTTP connections that get reused.

So when you run the serial version you can re-use the client instance for every file you process but you can only use one HTTP connection in the pool. With the concurrent.futures.ThreadPoolExecutor it can not only re-use the same instance of botocore.client.S3 it can cycle through all the HTTP connections in the pool.

The process based alternatives like multiprocessing.Pool and concurrent.futures.ProcessPoolExecutor can not re-use the botocore.client.S3 instance since it's not pickle'able. And it has to create a new HTTP connection for every single file.

So, the conclusion of the above rambling is that concurrent.futures.ThreadPoolExecutor is really awesome! Not only did it perform excellently in the Gzip benchmark, it has the added bonus that it can share instance objects and HTTP connections.

Simple or fancy UPSERT in PostgreSQL with Django

October 11, 2017
7 comments Python, Web development, Django, PostgreSQL

As of PostgreSQL 9.5 we have UPSERT support. Technically, it's ON CONFLICT, but it's basically a way to execute an UPDATE statement in case the INSERT triggers a conflict on some column value. By the way, here's a great blog post that demonstrates how to use ON CONFLICT.

In this Django app I have a model that has a field called hash which has a unique=True index on it. What I want to do is either insert a row, or if the hash is already in there, it should increment the count and the modified_at timestamp instead.

The Code(s)

Here's the basic version in "pure Django ORM":


if MissingSymbol.objects.filter(hash=hash_).exists():
    MissingSymbol.objects.filter(hash=hash_).update(
        count=F('count') + 1,
        modified_at=timezone.now()
    )
else:
    MissingSymbol.objects.create(
        hash=hash_,
        symbol=symbol,
        debugid=debugid,
        filename=filename,
        code_file=code_file or None,
        code_id=code_id or None,
    )

Here's that same code rewritten in "pure SQL":


from django.db import connection


with connection.cursor() as cursor:
    cursor.execute("""
        INSERT INTO download_missingsymbol (
            hash, symbol, debugid, filename, code_file, code_id,
            count, created_at, modified_at
        ) VALUES (
            %s, %s, %s, %s, %s, %s,
            1, CLOCK_TIMESTAMP(), CLOCK_TIMESTAMP()
          )
        ON CONFLICT (hash)
        DO UPDATE SET
            count = download_missingsymbol.count + 1,
            modified_at = CLOCK_TIMESTAMP()
        WHERE download_missingsymbol.hash = %s
        """, [
            hash_, symbol, debugid, filename,
            code_file or None, code_id or None,
            hash_
        ]
    )

Both work.

Note the use of CLOCK_TIMESTAMP() instead of NOW(). Since Django wraps all writes in transactions if you use NOW() it will be evaluated to the same value for the whole transaction, thus making unit testing really hard.

But which is fastest?

The Results

First of all, this hard to test locally because my Postgres is running locally in Docker so the network latency in talking to a network Postgres means that the latency is less and having to do two different executions would cost more if the network latency is more.

I ran a simple benchmark where it randomly picked one of the two code blocks (above) depending on a 50% chance.
The results are:

METHOD     MEAN       MEDIAN
SQL        6.99ms     6.61ms
ORM        10.28ms    9.86ms

So doing it with a block of raw SQL instead is 1.5 times faster. But this difference would surely grow when the network latency is higher.

Discussion

There's an alternative and that's to use django-postgres-extra but I'm personally hesitant. The above little raw SQL hack is the only thing I need and adding more libraries makes far-future maintenance harder.

Beyond the time optimization of being able to send only 1 SQL instruction to PostgreSQL, the biggest benefit is avoiding concurrency race conditions. From the documentation:

"ON CONFLICT DO UPDATE guarantees an atomic INSERT or UPDATE outcome; provided there is no independent error, one of those two outcomes is guaranteed, even under high concurrency. This is also known as UPSERT — "UPDATE or INSERT"."

I'm going to keep this little hack. It's not beautiful but it works and saves time and gives me more comfort around race conditions.

cache_memoize - a pretty decent cache decorator for Django

September 11, 2017
4 comments Python, Web development, Django

UPDATE - Oct 27, 2017 This snippet did now become its own PyPI package. See https://pypi.python.org/pypi/django-cache-memoize

This is something that's grown up organically when working on Mozilla Symbol Server. It has served me very well and perhaps it's worth extracting into its own lib.

Usage

Basically, you are probably used to this in Django:


from django.core.cache import cache

def compute_something(user, special=False):
    cache_key = 'meatycomputation:{}:special={}'.format(user.id, special)
    value = cache.get(cache_key)
    if value is None:
        value = _call_the_meat(user.id, special)  # some really slow function
        cache.set(cache_key, value, 60 * 5)
    return value

Here's instead how you can do exactly the same with cache_memoize:


from wherever.decorators import cache_memoize

@cache_memoize(60 * 5)
def compute_something(user, special=False):
    return _call_the_meat(user.id, special)  # some really slow function

Cache invalidation

If you ever need to do non-trivial caching you know it's important to be able to invalidate the cache. Usually, to be able to do that you need to involved in how the cache key was created.

Consider our two examples above, here's first the common thing to do:


def save_user(user):
    do_something_that_will_need_to_cache_invalidate(user)

    cache_key = 'meatycomputation:{}:special={}'.format(user.id, False)
    cache.delete(cache_key)
    # And when it was special=True
    cache_key = 'meatycomputation:{}:special={}'.format(user.id, True)
    cache.delete(cache_key)

This works but it involves repeating the code that generates the cache key. You could extract that into its own function of course.

Here's how you do it with the cache_memoize decorator:


def save_user(user):
    do_something_that_will_need_to_cache_invalidate(user)

    compute_something.invalidate(user, special=False)
    compute_something.invalidate(user, special=True)    

Other features

There are actually two ways to "invalidate" the cache. Calling the new myoriginalfunction.invalidate(...) function or passing a custom extra keyword argument called _refresh. For example: compute_something(user, _refresh=True).

You can pass callables that get called when the cache works in your favor or when it's a cache miss. For example:


def increment_hits(user, special=None):
    # use your imagination
    metrics.incr(user.email)

def cache_miss(user, special=None):
    print("cache miss on {}".format(user.email))

@cache_memoize(
    60 * 5,
    hit_callable=increment_hits,
    miss_callable=cache_miss,
)
def compute_something(user, special=False):
    return _call_the_meat(user.id, special)  # some really slow function

Sometimes you just want to use the memoizer to make sure something only gets called "once" (or once per time interval). In that case it might be smart to not flood your cache backend with the value of the function output if there is one. For example:


@cache_memoize(60 * 60, store_result=False)  # idempotent guard
def calculate_and_update(user):
    # do something expensive here that is best to only do once per hour

Internally cache_memoize will basically try to convert every argument and keyword argument to a string with, kinda, str(). That might not always be appropriate because you might know that you have two distinct objects whose __str__ will yield the same result. For that you can use the args_rewrite parameter. For example:


def simplify_special_objects(obj):
    # use your imagination
    return obj.hostname 

@cache_memoize(60 * 5, args_rewrite=simplify_special_objects)
def compute_something(special_obj):
    return _call_the_meat(special_obj.hostname)

In conclusion

I've uploaded the code as a gist.

It's quite possible that there's already a perfectly good lib that does exactly this. If so, thanks for letting me know. If not, perhaps I ought to wrap this up and publish it on PyPI. Again, that's for letting me know.

UPDATE

I found a bug in the original gist. Updated 2017-10-05.
The bug was that the calling of miss_callable and hit_callable was reversed.

Mozilla Symbol Server (aka. Tecken) load testing

September 6, 2017
0 comments Python, Web development, Django, Mozilla

(Thanks Miles Crabil not only for being an awesome Ops person but also for reviewing this blog post!)

My project over the summer, here at Mozilla, has been a project called Mozilla Symbol Server. It's a web service that uploads C++ symbol files, downloads C++ symbol files and symbolicates C++ crash stacktraces. It went into production last week which was fun but there's still lots of work to do on adding beyond-parity features and more optimizations.

What Is Mozilla Symbol Server?

The code name for this project is Tecken and it's written in Python (Django, Gunicorn) and uses PostgreSQL, Redis and Celery. The frontend is entirely static and developed (almost) as a separate project within. The frontend is written in React (using create-react-app and react-router). Everything is run as Docker containers. And if you ask me more details about how it's configured/deployed I'm afraid I have to defer to the awesome Mozilla CloudOps team.

One the challenges I faces developing Tecken is that symbol downloads need to be fast to handle high volumes of traffic. Today I did some load testing on our stage deployment and managed to start 14 concurrent clients that bombarded our staging server with realistic HTTPS GET queries based on log files. It's actually 7 + 1 + 4 + 2 concurrent clients. 7 of them from a m3.2xlarge EC2 node (8 vCPUs), 1 from a m3.large EC2 node (1 vCPU), 2 from two separate NYC based DigitalOcean personal servers and 2 clients here from my laptop on my home broadband. Basically, each loadtest script process got its own CPU.

Total req/s
It's hard to know how much more each client could push if it wasn't slowed down. Either way, the server managed to sustain about 330 requests per second. Our production baseline goal is to able to handle at least 40 requests per second.

After running for a while the caches started getting warm but about 1-5% of requests do have to make a boto3 roundtrip to an S3 bucket located on the other side of America in Oregon. There is also a ~5% penalty in that some requests trigger a write to a central Redis ElastiCache server. That's cheaper than the boto3 S3 call but still hefty latency costs to pay.

The ELB in our staging environment spreads the load between 2 c4.large (2 vCPUs, 3.75GB RAM) EC2 web heads. Each running with preloaded Gunicorn workers between Nginx and Django. Each web head has its own local memcached server to share memory between each worker but only local to the web head.

Is this a lot?

How long is a rope? Hard to tell. Tecken's performance is certainly more than enough and by the sheer fact that it was only just production deployed last week tells me we can probably find a lot of low-hanging fruit optimizations on the deployment side over time.

One way of answering that is to compare it with our lightest endpoint. One that involves absolutely no external resources. It's just pure Python in the form of ELB → Nginx → Gunicorn → Django. If I run hey from the same server I did the load testing I get a topline of 1,300 requests per second.

$ hey -n 10000 -c 10 https://symbols.stage.mozaws.net/__lbheartbeat__
Summary:
  Total:    7.6604 secs
  Slowest:  0.0610 secs
  Fastest:  0.0018 secs
  Average:  0.0075 secs
  Requests/sec: 1305.4199
...

That basically means that all the extra "stuff" (memcache key prep, memcache key queries and possible other high latency network requests) it needs to do in the Django view takes up roughly 3x the time it takes the absolute minimal Django request-response rendering.

Also, if I use the same technique to bombard a single URL, but one that actually involves most code steps but is definitely able to not require any slow ElastiCache writes or boto3 S3 reads you I get 800 requests per second:

$ hey -n 10000 -c 10 https://symbols.stage.mozaws.net/advapi32.pdb/5EFB9BF42CC64024AB64802E467394642/advapi32.sy
Summary:
  Total:    12.4160 secs
  Slowest:  0.0651 secs
  Fastest:  0.0024 secs
  Average:  0.0122 secs
  Requests/sec: 805.4150
  Total data:   300000 bytes
  Size/request: 30 bytes
...

Lesson learned

Max CPU Used
It's a recurring reminder that performance is almost all about latency. If not RAM or disk it's networking. See the graph of the "Max CPU Used" which basically shows that CPU of user, system and stolen ("CPU spent waiting for the hypervisor to service another virtual CPU") never sum totalling over 50%.

Fastest way to match a filename's extension in Python

August 31, 2017
4 comments Python

tl;dr; By a slim margin, the fastest way to check a filename matching a list of extensions is filename.endswith(extensions)

This turned out to be premature optimization. The context is that I want to check if a filename matches the file extension in a list of 6.

The list being ['.sym', '.dl_', '.ex_', '.pd_', '.dbg.gz', '.tar.bz2']. Meaning, it should return True for foo.sym or foo.dbg.gz. But it should return False for bar.exe or bar.gz.

I put together a litte benchmark, ran it a bunch of times and looked at the results. Here are the functions I wrote:


def f1(filename):
    for each in extensions:
        if filename.endswith(each):
            return True
    return False


def f2(filename):
    return filename.endswith(extensions_tuple)


regex = re.compile(r'({})$'.format(
    '|'.join(re.escape(x) for x in extensions)
))


def f3(filename):
    return bool(regex.findall(filename))


def f4(filename):
    return bool(regex.search(filename))

The results are boring. But I guess that's a result too:

FUNCTION             MEDIAN               MEAN
f1 9543 times        0.0110ms             0.0116ms
f2 9523 times        0.0031ms             0.0034ms
f3 9560 times        0.0041ms             0.0045ms
f4 9509 times        0.0041ms             0.0043ms

For a list of ~40,000 realistic filenames (with result True 75% of the time), I ran each function 10 times. So, it means it took on average 0.0116ms to run f1 10 times here on my laptop with Python 3.6.

More premature optimization

Upon looking into the data and thinking about this will be used. If I reorder the list of extensions so the most common one is first, second most common second etc. Then the performance improves a bit for f1 but slows down slightly for f3 and f4.

Conclusion

That .endswith(some_tuple) is neat and it's hair-splittingly faster. But really, this turned out to not make a huge difference in the grand scheme of things. On average it takes less than 0.001ms to do one filename match.

Fastest *local* cache backend possible for Django

August 4, 2017
11 comments Python, Web development, Django

I did another couple of benchmarks of different cache backends in Django. This is an extension/update on Fastest cache backend possible for Django published a couple of months ago. This benchmarking isn't as elaborate as the last one. Fewer tests and fewer variables.

I have another app where I use a lot of caching. This web application will run its cache server on the same virtual machine. So no separation of cache server and web head(s). Just one Django server talking to localhost:11211 (memcached's default port) and localhost:6379 (Redis's default port).

Also in this benchmark, the keys were slightly smaller. To simulate my applications "realistic needs" I made the benchmark fall on roughly 80% cache hits and 20% cache misses. The cache keys were 1 to 3 characters long and the cache values lists of strings always 30 items long (e.g. len(['abc', 'def', 'cba', ... , 'cab']) == 30).

Also, in this benchmark I was too lazy to test all different parsers, serializers and compressors that django-redis supports. I only test python-memcached==1.58 versus django-redis==4.8.0 versus django-redis==4.8.0 && msgpack-python==0.4.8.

The results are quite "boring". There's basically not enough difference to matter.

Config Average Median Compared to fastest
memcache 4.51s 3.90s 100%
redis 5.41s 4.61s 84.7%
redis_msgpack 5.16s 4.40s 88.8%

UPDATE

As Hal pointed out in the comment, when you know the web server and the memcached server is on the same computer you should use UNIX sockets. They're "obviously" faster since the lack of HTTP overhead at the cost of it doesn't work over a network.

Because running memcached on a socket on OSX is a hassle I only have one benchmark. Note! This basically compares good old django.core.cache.backends.memcached.MemcachedCache with two different locations.

Config Average Median Compared to fastest
127.0.0.1:11211 3.33s 3.34s 81.3%
unix:/tmp/memcached.sock 2.66s 2.71s 100%

But there's more! Another option is to use pylibmc which is a Python client written in C. By the way, my Python I use for these microbenchmarks is Python 3.5.

Unfortunately I'm too lazy/too busy to do a matrix comparison of pylibmc on TCP versus UNIX socket. Here are the comparison results of using python-memcached versus pylibmc:

Client Average Median Compared to fastest
python-memcached 3.52s 3.52s 62.9%
pylibmc 2.31s 2.22s 100%

UPDATE 2

https://plot.ly/~jensens/36.embed

Seems my luck someone else has done the matrix comparison of python-memcached vs pylibmc on TCP vs UNIX socket:

https://plot.ly/~jensens/36.embed

Find static files defined in django-pipeline but not found

July 25, 2017
0 comments Python, Django

If you're reading this you're probably familiar with how, in django-pipeline, you define bundles of static files to be combined and served. If you're not familiar with django-pipeline it's unlike this'll be of much help.

The Challenge (aka. the pitfall)

So you specify bundles by creating things in your settings.py something like this:


PIPELINE = {
    'STYLESHEETS': {
        'colors': {
            'source_filenames': (
              'css/core.css',
              'css/colors/*.css',
              'css/layers.css'
            ),
            'output_filename': 'css/colors.css',
            'extra_context': {
                'media': 'screen,projection',
            },
        },
    },
    'JAVASCRIPT': {
        'stats': {
            'source_filenames': (
              'js/jquery.js',
              'js/d3.js',
              'js/collections/*.js',
              'js/aplication.js',
            ),
            'output_filename': 'js/stats.js',
        }
    }
}

You do a bit more configuration and now, when you run ./manage.py collectstatic --noinput Django and django-pipeline will gather up all static files from all Django apps installed, then start post processing then and doing things like concatenating them into one file and doing stuff like minification etc.

The problem is, if you look at the example snippet above, there's a typo. Instead of js/application.js it's accidentally js/aplication.js. Oh noes!!

What's sad is it that nobody will notice (running ./manage.py collectstatic will exit with a 0). At least not unless you do some careful manual reviewing. Perhaps you will notice later, when you've pushed the site to prod, that the output file js/stats.js actually doesn't contain the code from js/application.js.

Or, you can automate it!

A Solution (aka. the hack)

I started this work this morning because the error actually happened to us. Thankfully not in production but our staging server produced a rendered HTML page with <link href="/static/css/report.min.cd784b4a5e2d.css" rel="stylesheet" type="text/css" /> which was an actual file but it was 0 bytes.

It wasn't that hard to figure out what the problem was because of the context of recent changes but it would have been nice to catch this during continuous integration.

So what we did was add an extra class to settings.STATICFILES_FINDERS called myproject.base.finders.LeftoverPipelineFinder. So now it looks like this:


# in settings.py

STATICFILES_FINDERS = (
    'django.contrib.staticfiles.finders.FileSystemFinder',
    'django.contrib.staticfiles.finders.AppDirectoriesFinder',
    'pipeline.finders.PipelineFinder',
    'myproject.finders.LeftoverPipelineFinder',  # the new hotness!
)

And here's the class implementation:


from pipeline.finders import PipelineFinder

from django.conf import settings
from django.core.exceptions import ImproperlyConfigured


class LeftoverPipelineFinder(PipelineFinder):
    """This finder is expected to come AFTER 
    django.contrib.staticfiles.finders.FileSystemFinder and 
    django.contrib.staticfiles.finders.AppDirectoriesFinder in 
    settings.STATICFILES_FINDERS.
    If a path is looked for here it means it's trying to find a file
    that none of the regular staticfiles finders couldn't find.
    """
    def find(self, path, all=False):
        # Before we raise an error, try to find out where,
        # in the bundles, this was defined. This will make it easier to correct
        # the mistake.
        for config_name in 'STYLESHEETS', 'JAVASCRIPT':
            config = settings.PIPELINE[config_name]
            for key in config:
                if path in config[key]['source_filenames']:
                    raise ImproperlyConfigured(
                        'Static file {!r} can not be found anywhere. Defined in '
                        "PIPELINE[{!r}][{!r}]['source_filenames']".format(
                            path,
                            config_name,
                            key,
                        )
                    )
        # If the file can't be found AND it's not in bundles, there's
        # got to be something else really wrong.
        raise NotImplementedError(path)

Now, if you have a typo or something in your bundles, you'll get a nice error about it as soon as you try to run collectstatic. For example:

▶ ./manage.py collectstatic --noinput
Post-processed 'css/search.min.css' as 'css/search.min.css'
Post-processed 'css/base.min.css' as 'css/base.min.css'
Post-processed 'css/base-dynamic.min.css' as 'css/base-dynamic.min.css'
Post-processed 'js/google-analytics.min.js' as 'js/google-analytics.min.js'
Traceback (most recent call last):
...
django.core.exceptions.ImproperlyConfigured: Static file 'js/aplication.js' can not be found anywhere. Defined in PIPELINE['JAVASCRIPT']['stats']['source_filenames']

Final Thoughts

This was a morning hack. I'm still not entirely sure if this the best approach, but there was none better and the result is pretty good.

We run ./manage.py collectstatic --noinput in our continous integration just before it runs ./manage.py test. So if you make a Pull Request that has a typo in bundles.py it will get caught.

Unfortunately, it won't find missing files if you use foo*.js or something like that. django-pipeline uses glob.glob to convert expressions like that into a list of actual files and that depends on the filesystem and all of that happens before the django.contrib.staticfiles.finders.find function is called.

If you have any better suggestions to solve this, please let me know.

How to do performance micro benchmarks in Python

June 24, 2017
7 comments Python

Suppose that you have a function and you wonder, "Can I make this faster?" Well, you might already have thought that and you might already have a theory. Or two. Or three. Your theory might be sound and likely to be right, but before you go anywhere with it you need to benchmark it first. Here are some tips and scaffolding for doing Python function benchmark comparisons.

Tenets

  1. Internally, Python will warm up and it's likely that your function depends on other things such as databases or IO. So it's important that you don't test function1 first and then function2 immediately after because function2 might benefit from a warm up painfully paid for by function1. So mix up the order of them or cycle through them enough that they all pay for or gain from warm ups.

  2. Look at the median first. The mean (aka. average) is often tainted by spikes and these spikes of slow-down can be caused by your local Spotify client deciding to reindex itself or something some such. Sometimes those spikes matter. For example, garbage collection is inevitable and will have an effect that matters.

  3. Run your functions many times. So many times that the whole benchmark takes a while. Like tens of seconds or more. Also, if you run it significantly long it's likely that all candidates gets punished by the same environmental effects such as garbage collection or CPU being reassinged to something else intensive on your computer.

  4. Try to take your benchmark into different, and possibly more realistic environments. For example, don't rely on reading a file like /Users/peterbe/only/on/my/macbook when, likely, the end destination for your code is an Ubuntu server in AWS. Write your code so that it's easy to copy and paste around, like into a vi/jed editor in an ssh session somewhere.

  5. Sanity check each function before benchmarking them. No need for pytest or anything fancy but just make sure that you test them in some basic way. But the assertion testing is likely to add to the total execution time so don't do it when running the functions.

  6. Avoid "prints" inside the time measured code. A print() is I/O and an "external resource" that can become very unfair to compare CPU bound performance.

  7. Don't fear testing many different functions. If you have multiple ideas of doing a function differently, it's cheap to pile them on. But be careful how you "report" because if there are many different ways of doing something you might accidentally compare different fruit without noticing.

  8. Make sure your functions take at least one parameter. I'm no Python core developer or C hacker but I know there are "murks" within a compiler and interpreter that might do what a regular memoizer might done. Also, the performance difference can be reversed on tiny inputs compared to really large ones.

  9. Be humble with the fact that 0.01 milliseconds difference when doing 10,000 iterations is probably not worth writing a more complex and harder-to-debug function.

The Boilerplate

Let's demonstrate with an example:


# The functions to compare
import math


def f1(degrees):
    return math.cos(degrees)


def f2(degrees):
    e = 2.718281828459045
    return (
        (e**(degrees * 1j) + e**-(degrees * 1j)) / 2
    ).real


# Assertions
assert f1(100) == f2(100) == 0.862318872287684
assert f1(1) == f2(1) == 0.5403023058681398


# Reporting
import time
import random
import statistics

functions = f1, f2
times = {f.__name__: [] for f in functions}

for i in range(100000):  # adjust accordingly so whole thing takes a few sec
    func = random.choice(functions)
    t0 = time.time()
    func(i)
    t1 = time.time()
    times[func.__name__].append((t1 - t0) * 1000)

for name, numbers in times.items():
    print('FUNCTION:', name, 'Used', len(numbers), 'times')
    print('\tMEDIAN', statistics.median(numbers))
    print('\tMEAN  ', statistics.mean(numbers))
    print('\tSTDEV ', statistics.stdev(numbers))

Let's break that down a bit.

  • The first area (# The functions to compare) is all up to you. This silly example tries to peg Python's builtin math.cos against your own arithmetic expression.

  • The second area (# Assertions) is where you do some basic sanity checks/tests. This comes in handy to make sure if you keep modifying the functions more and more to try to squeeze out some extra juice.

  • The last area (# Reporting) is the boilerplat'y area. You obviously have to change the line functions = f1, f2 to include all the named functions you have in the first area. And the number of iterations totally depends on how long the functions take to run. Here it's 100,000 times which is kinda ridiculous but I just needed a dead simple function to demonstrate.

  • Note that each measurement is in milliseconds.

You run that and get something like this:

FUNCTION: f1 Used 49990 times
    MEDIAN 0.0
    MEAN   0.00045161219591330375
    STDEV  0.0011268475946446341
FUNCTION: f2 Used 50010 times
    MEDIAN 0.00095367431640625
    MEAN   0.0009188626294516487
    STDEV  0.000642871632138125

More Examples

The example above already broke one of the tenets in that these functions were simply too fast. Doing rather basic mathematics is just too fast to compare with such a trivial benchmark. Here are some other examples:

Remove duplicates from list without losing order


# The functions to compare


def f1(seq):
    checked = []
    for e in seq:
        if e not in checked:
            checked.append(e)
    return checked


def f2(seq):
    checked = []
    seen = set()
    for e in seq:
        if e not in seen:
            checked.append(e)
            seen.add(e)
    return checked


def f3(seq):
    checked = []
    [checked.append(i) for i in seq if not checked.count(i)]
    return checked


def f4(seq):
    seen = set()
    return [x for x in seq if x not in seen and not seen.add(x)]


def f5(seq):
    def generator():
        seen = set()
        for x in seq:
            if x not in seen:
                seen.add(x)
                yield x

    return list(generator())


# Assertion
import random

def _random_seq(length):
    seq = []
    for _ in range(length):
        seq.append(random.choice(
            'abcdefghijklmnopqrstuvwxyzABCDEFGHIJKLMNOPQRSTUVWXYZ'
        ))
    return seq


L = list('abca')
assert f1(L) == f2(L) == f3(L) == f4(L) == f5(L) == list('abc')
L = _random_seq(10)
assert f1(L) == f2(L) == f3(L) == f4(L) == f5(L)

# Reporting
import time
import statistics

functions = f1, f2, f3, f4, f5
times = {f.__name__: [] for f in functions}

for i in range(3000):
    seq = _random_seq(i)
    for _ in range(len(functions)):
        func = random.choice(functions)
        t0 = time.time()
        func(seq)
        t1 = time.time()
        times[func.__name__].append((t1 - t0) * 1000)

for name, numbers in times.items():
    print('FUNCTION:', name, 'Used', len(numbers), 'times')
    print('\tMEDIAN', statistics.median(numbers))
    print('\tMEAN  ', statistics.mean(numbers))
    print('\tSTDEV ', statistics.stdev(numbers))

Results:

FUNCTION: f1 Used 3029 times
    MEDIAN 0.6871223449707031
    MEAN   0.6917867380307822
    STDEV  0.42611748137761174
FUNCTION: f2 Used 2912 times
    MEDIAN 0.054955482482910156
    MEAN   0.05610262627130026
    STDEV  0.03000829926668248
FUNCTION: f3 Used 2985 times
    MEDIAN 1.4472007751464844
    MEAN   1.4371055654145566
    STDEV  0.888658217522005
FUNCTION: f4 Used 2965 times
    MEDIAN 0.051975250244140625
    MEAN   0.05343245816673035
    STDEV  0.02957275548477728
FUNCTION: f5 Used 3109 times
    MEDIAN 0.05507469177246094
    MEAN   0.05678296204202234
    STDEV  0.031521596461048934

Winner:


def f4(seq):
    seen = set()
    return [x for x in seq if x not in seen and not seen.add(x)]

Fastest way to count the number of lines in a file


# The functions to compare
import codecs
import subprocess


def f1(filename):
    count = 0
    with codecs.open(filename, encoding='utf-8', errors='ignore') as f:
        for line in f:
            count += 1
    return count


def f2(filename):
    with codecs.open(filename, encoding='utf-8', errors='ignore') as f:
        return len(f.read().splitlines())


def f3(filename):
    return int(subprocess.check_output(['wc', '-l', filename]).split()[0])


# Assertion
filename = 'big.csv'
assert f1(filename) == f2(filename) == f3(filename) == 9999


# Reporting
import time
import statistics
import random

functions = f1, f2, f3
times = {f.__name__: [] for f in functions}

filenames = 'dummy.py', 'hacker_news_data.txt', 'yarn.lock', 'big.csv'
for _ in range(200):
    for fn in filenames:
        for func in functions:
            t0 = time.time()
            func(fn)
            t1 = time.time()
            times[func.__name__].append((t1 - t0) * 1000)

for name, numbers in times.items():
    print('FUNCTION:', name, 'Used', len(numbers), 'times')
    print('\tMEDIAN', statistics.median(numbers))
    print('\tMEAN  ', statistics.mean(numbers))
    print('\tSTDEV ', statistics.stdev(numbers))

Results:

FUNCTION: f1 Used 800 times
    MEDIAN 5.852460861206055
    MEAN   25.403797328472137
    STDEV  37.09347378640582
FUNCTION: f2 Used 800 times
    MEDIAN 0.45299530029296875
    MEAN   2.4077045917510986
    STDEV  3.717931526478758
FUNCTION: f3 Used 800 times
    MEDIAN 2.8804540634155273
    MEAN   3.4988239407539368
    STDEV  1.3336427480808102

Winner:


def f2(filename):
    with codecs.open(filename, encoding='utf-8', errors='ignore') as f:
        return len(f.read().splitlines())

Conclusion

No conclusion really. Just wanted to point out that this is just a hint of a decent start when doing performance benchmarking of functions.

There is also the timeit built-in for "provides a simple way to time small bits of Python code" but it has the disadvantage that your functions are not allowed to be as complex. Also, it's harder to generate multiple different fixtures to feed your functions without that fixture generation effecting the times.

There's a lot of things that this boilerplate can improve such as sorting by winner, showing percentages comparisons against the fastests, ASCII graphs, memory allocation differences, etc. That's up to you.

Fastest way to find out if a file exists in S3 (with boto3)

June 16, 2017
9 comments Python, Web development

tl;dr; It's faster to list objects with prefix being the full key path, than to use HEAD to find out of a object is in an S3 bucket.

Background

I have a piece of code that opens up a user uploaded .zip file and extracts its content. Then it uploads each file into an AWS S3 bucket if the file size is different or if the file didn't exist at all before.

It looks like this:


for filename, filesize, fileobj in extract(zip_file):
    size = _size_in_s3(bucket, filename)
    if size is None or size != filesize:
        upload_to_s3(bucket, filename, fileobj)
        print('Updated!' if size else 'New!')
    else:
        print('Ignored')

I'm using the boto3 S3 client so there are two ways to ask if the object exists and get its metadata.

Option 1: client.head_object

Option 2: client.list_objects_v2 with Prefix=${keyname}.

But why the two different approaches?

The problem with client.head_object is that it's odd in how it works. Sane but odd. If the object does not exist, boto3 raises a botocore.exceptions.ClientError which contains a response and in it you can look for exception.response['Error']['Code'] == '404'.

What I noticed was that if you use a try:except ClientError: approach to figure out if an object exists, you reset the client's connection pool in urllib3. So after an exception has happened, any other operations on the client causes it to have to, internally, create a new HTTPS connection. That can cost time.

I wrote and filed this issue on github.com/boto/boto3.

So I wrote two different functions to return an object's size if it exists:


def _key_existing_size__head(client, bucket, key):
    """return the key's size if it exist, else None"""
    try:
        obj = client.head_object(Bucket=bucket, Key=key)
        return obj['ContentLength']
    except ClientError as exc:
        if exc.response['Error']['Code'] != '404':
            raise

And the contender...:


def _key_existing_size__list(client, bucket, key):
    """return the key's size if it exist, else None"""
    response = client.list_objects_v2(
        Bucket=bucket,
        Prefix=key,
    )
    for obj in response.get('Contents', []):
        if obj['Key'] == key:
            return obj['Size']

They both work. That was easy to test. But which is fastest?

Before we begin, which do you think is fastest? The head_object feels like it'll be able to send an operation to S3 internally to do a key lookup directly. But S3 isn't a normal database.

Here's the script partially cleaned up but should be easy to run.

The results

So I wrote a loop that ran 1,000 times and I made sure the bucket was empty so that 1,000 times the result of the iteration is that it sees that the file doesn't exist and it has to do a client.put_object.

Here are the results:

FUNCTION: _key_existing_size__list Used 511 times
    SUM    148.2740752696991
    MEAN   0.2901645308604679
    MEDIAN 0.2569708824157715
    STDEV  0.17742598775696436

FUNCTION: _key_existing_size__head Used 489 times
    SUM    249.79622673988342
    MEAN   0.510830729529414
    MEDIAN 0.4780092239379883
    STDEV  0.14352671121877011

Because it's network bound, it's really important to avoid the 'MEAN' and instead look at the 'MEDIAN'. My home broadband can cause temporary spikes.

Clearly, using client.list_objects_v2 is faster. It's 90% faster than client.head_object.

But note! this was 1,000 times of B) "does the file already exist?" and B) "No? Ok upload it". So the times there include all the client.put_object calls.

So why did I measure both? I.e. _key_existing_size__list+client.put_object versus. _key_existing_size__head+client.put_object? The reason is that the approach of using try:except ClientError: followed by a client.put_object causes boto3 to create a new HTTPS connection in its pool. Again, see the issue which demonstrates this in different words.

What if the object always exists?

So, I simply run the benchmark again. The first time, it uploaded all 1,000 uniquely named objects. So running it a second time, every time the answer is that the object exists, and its size hasn't changed, so it never triggers the client.put_object.

Here are the results this time:

FUNCTION: _key_existing_size__list Used 495 times
    SUM    54.60546112060547
    MEAN   0.11031406286991004
    MEDIAN 0.08583354949951172
    STDEV  0.06339202669609442

FUNCTION: _key_existing_size__head Used 505 times
    SUM    44.59347581863403
    MEAN   0.0883039125121466
    MEDIAN 0.07310152053833008
    STDEV  0.054452842190700346

In this case, using client.head_object is faster. By 20% but the median time is 0.08 seconds! Even on a home broadband connection. In other words, I don't think that difference is significant.

One more time, excluding the client.put_object

The point of using client.list_objects_v2 instead of client.head_object was to avoid breaking the connection pool in urllib3 that boto3 manages somehow. Having to create a new HTTPS connection (and adding it to the pool) costs time, but what if we disregard that and compare the two functions "purely" on how long they take when the file does NOT exist? Remember, the second measurement above was when every object exists.

So we know it took 0.09 seconds and 0.07 seconds respectively for the two functions to figure out that the object does exist. How long does it take to figure out that the object does not exist independent of any other op. I.e. just try each one without doing a client.put_object afterwards. That means we avoid the bug so the comparison is fair.

The results:

FUNCTION: _key_existing_size__list Used 499 times
    SUM    123.57429671287537
    MEAN   0.247643881188127
    MEDIAN 0.2196049690246582
    STDEV  0.18622877427652743

FUNCTION: _key_existing_size__head Used 501 times
    SUM    112.99495434761047
    MEAN   0.22553883103315464
    MEDIAN 0.2828958034515381
    STDEV  0.15342842113446084

The client.list_objects_v2 beats client.head_object by 30%. And it matters. Above I said that 20% difference didn't matter but now it does. That's because the time difference when it always finds the object was 0.013 seconds. When it comes to figuring out that the object did not exist the time difference is 0.063 seconds. That's still a pretty small number but, hey, you gotto draw the line somewhere.

In conclusion

Using client.list_objects_v2 is a better alternative to using client.head_object.

If you think you'll often find that the object doesn't exist and needs a client.put_object then using client.list_objects_v2 is 90% faster. If you think you'll rarely need client.put_object (i.e. that most objects don't change) then client.list_objects_v2 is almost the same performance.

Fastest Redis configuration for Django

May 11, 2017
1 comment Python, Linux, Web development, Django

I have an app that does a lot of Redis queries. It all runs in AWS with ElastiCache Redis. Due to the nature of the app, it stores really large hash tables in Redis. The application then depends on querying Redis for these. The question is; What is the best configuration possible for the fastest service possible?

Note! Last month I wrote Fastest cache backend possible for Django which looked at comparing Redis against Memcache. Might be an interesting read too if you're not sold on Redis.

Options

All options are variations on the compressor, serializer and parser which are things you can override in django-redis. All have an effect on the performance. Even compression, for if the number of bytes between Redis and the application is smaller, then it should have better network throughput.

Without further ado, here are the variations:


CACHES = {
    "default": {
        "BACKEND": "django_redis.cache.RedisCache",
        "LOCATION": config('REDIS_LOCATION', 'redis://127.0.0.1:6379') + '/0',
        "OPTIONS": {
            "CLIENT_CLASS": "django_redis.client.DefaultClient",
        }
    },
    "json": {
        "BACKEND": "django_redis.cache.RedisCache",
        "LOCATION": config('REDIS_LOCATION', 'redis://127.0.0.1:6379') + '/1',
        "OPTIONS": {
            "CLIENT_CLASS": "django_redis.client.DefaultClient",
            "SERIALIZER": "django_redis.serializers.json.JSONSerializer",
        }
    },
    "ujson": {
        "BACKEND": "django_redis.cache.RedisCache",
        "LOCATION": config('REDIS_LOCATION', 'redis://127.0.0.1:6379') + '/2',
        "OPTIONS": {
            "CLIENT_CLASS": "django_redis.client.DefaultClient",
            "SERIALIZER": "fastestcache.ujson_serializer.UJSONSerializer",
        }
    },
    "msgpack": {
        "BACKEND": "django_redis.cache.RedisCache",
        "LOCATION": config('REDIS_LOCATION', 'redis://127.0.0.1:6379') + '/3',
        "OPTIONS": {
            "CLIENT_CLASS": "django_redis.client.DefaultClient",
            "SERIALIZER": "django_redis.serializers.msgpack.MSGPackSerializer",
        }
    },
    "hires": {
        "BACKEND": "django_redis.cache.RedisCache",
        "LOCATION": config('REDIS_LOCATION', 'redis://127.0.0.1:6379') + '/4',
        "OPTIONS": {
            "CLIENT_CLASS": "django_redis.client.DefaultClient",
            "PARSER_CLASS": "redis.connection.HiredisParser",
        }
    },
    "zlib": {
        "BACKEND": "django_redis.cache.RedisCache",
        "LOCATION": config('REDIS_LOCATION', 'redis://127.0.0.1:6379') + '/5',
        "OPTIONS": {
            "CLIENT_CLASS": "django_redis.client.DefaultClient",
            "COMPRESSOR": "django_redis.compressors.zlib.ZlibCompressor",
        }
    },
    "lzma": {
        "BACKEND": "django_redis.cache.RedisCache",
        "LOCATION": config('REDIS_LOCATION', 'redis://127.0.0.1:6379') + '/6',
        "OPTIONS": {
            "CLIENT_CLASS": "django_redis.client.DefaultClient",
            "COMPRESSOR": "django_redis.compressors.lzma.LzmaCompressor"
        }
    },
}

As you can see, they each have a variation on the OPTIONS.PARSER_CLASS, OPTIONS.SERIALIZER or OPTIONS.COMPRESSOR.

The default configuration is to use redis-py and to pickle the Python objects to a bytestring. Pickling in Python is pretty fast but it has the disadvantage that it's Python specific so you can't have a Ruby application reading the same Redis database.

The Experiment

Note how I have one LOCATION per configuration. That's crucial for the sake of testing. That way one database is all JSON and another is all gzip etc.

What the benchmark does is that it measures how long it takes to READ a specific key (called benchmarking). Then, once it's done that it appends that time to the previous value (or [] if it was the first time). And lastly it writes that list back into the database. That way, towards the end you have 1 key whose value looks something like this: [0.013103008270263672, 0.003879070281982422, 0.009411096572875977, 0.0009970664978027344, 0.0002830028533935547, ..... MANY MORE ....].

Towards the end, each of these lists are pretty big. About 500 to 1,000 depending on the benchmark run.

In the experiment I used wrk to basically bombard the Django server on the URL /random (which makes a measurement with a random configuration). On the EC2 experiment node, it finalizes around 1,300 requests per second which is a decent number for an application that does a fair amount of writes.

The way I run the Django server is with uwsgi like this:

uwsgi --http :8000 --wsgi-file fastestcache/wsgi.py --master --processes 4 --threads 2

And the wrk command like this:

wrk -d30s  "http://127.0.0.1:8000/random"

(that, by default, runs 2 threads on 10 connections)

At the end of starting the benchmarking, I open http://localhost:8000/summary which spits out a table and some simple charts.

An Important Quirk

Time measurements over time
One thing I noticed when I started was that the final numbers' average was very different from the medians. That would indicate that there are spikes. The graph on the right shows the times put into that huge Python list for the default configuration for the first 200 measurements. Note that there are little spikes but generally quite flat over time once it gets past the beginning.

Sure enough, it turns out that in almost all configurations, the time it takes to make the query in the beginning is almost order of magnitude slower than the times once the benchmark has started running for a while.

So in the test code you'll see that it chops off the first 10 times. Perhaps it should be more than 10. After all, if you don't like the spikes you can simply look at the median as the best source of conclusive truth.

The Code

The benchmarking code is here. Please be aware that this is quite rough. I'm sure there are many things that can be improved, but I'm not sure I'm going to keep this around.

The Equipment

The ElastiCache Redis I used was a cache.m3.xlarge (13 GiB, High network performance) with 0 shards and 1 node and no multi-zone enabled.

The EC2 node was a m4.xlarge Ubuntu 16.04 64-bit (4 vCPUs and 16 GiB RAM with High network performance).

Both the Redis and the EC2 were run in us-west-1c (North Virginia).

The Results

Here are the results! Sorry if it looks terrible on mobile devices.

root@ip-172-31-2-61:~# wrk -d30s  "http://127.0.0.1:8000/random" && curl "http://127.0.0.1:8000/summary"
Running 30s test @ http://127.0.0.1:8000/random
  2 threads and 10 connections
  Thread Stats   Avg      Stdev     Max   +/- Stdev
    Latency     9.19ms    6.32ms  60.14ms   80.12%
    Req/Sec   583.94    205.60     1.34k    76.50%
  34902 requests in 30.03s, 2.59MB read
Requests/sec:   1162.12
Transfer/sec:     88.23KB
                         TIMES        AVERAGE         MEDIAN         STDDEV
json                      2629        2.596ms        2.159ms        1.969ms
msgpack                   3889        1.531ms        0.830ms        1.855ms
lzma                      1799        2.001ms        1.261ms        2.067ms
default                   3849        1.529ms        0.894ms        1.716ms
zlib                      3211        1.622ms        0.898ms        1.881ms
ujson                     3715        1.668ms        0.979ms        1.894ms
hires                     3791        1.531ms        0.879ms        1.800ms

Best Averages (shorter better)
###############################################################################
██████████████████████████████████████████████████████████████   2.596  json
█████████████████████████████████████                            1.531  msgpack
████████████████████████████████████████████████                 2.001  lzma
█████████████████████████████████████                            1.529  default
███████████████████████████████████████                          1.622  zlib
████████████████████████████████████████                         1.668  ujson
█████████████████████████████████████                            1.531  hires
Best Medians (shorter better)
###############################################################################
███████████████████████████████████████████████████████████████  2.159  json
████████████████████████                                         0.830  msgpack
████████████████████████████████████                             1.261  lzma
██████████████████████████                                       0.894  default
██████████████████████████                                       0.898  zlib
████████████████████████████                                     0.979  ujson
█████████████████████████                                        0.879  hires


Size of Data Saved (shorter better)
###############################################################################
█████████████████████████████████████████████████████████████████  60K  json
██████████████████████████████████████                             35K  msgpack
████                                                                4K  lzma
█████████████████████████████████████                              35K  default
█████████                                                           9K  zlib
████████████████████████████████████████████████████               48K  ujson
█████████████████████████████████████                              34K  hires

Discussion Points

  • There is very little difference once you avoid the json serialized one.
  • msgpack is the fastest by a tiny margin. I prefer median over average because it's more important how it over a long period of time.
  • The default (which is pickle) is fast too.
  • lzma and zlib compress the strings very well. Worth thinking about the fact that zlib is a very universal tool and makes the app "Python agnostic".
  • You probably don't want to use the json serializer. It's fat and slow.
  • Using hires makes very little difference. That's a bummer.
  • Considering how useful zlib is (since you can fit so much much more data in your Redis) it's impressive that it's so fast too!
  • I quite like zlib. If you use that on the pickle serializer you're able to save ~3.5 times as much data.
  • Laugh all you want but until today I had never heard of lzma. So based on that odd personal fact, I'm pessmistic towards that as a compression choice.

Conclusion

This experiment has lead me to the conclusion that the best serializer is msgpack and the best compression is zlib. That is the best configuration for django-redis.

msgpack has implementation libraries for many other programming languages. Right now that doesn't matter for my application but if msgpack is both faster and more versatile (because it supports multiple languages) I conclude that to be the best serializer instead.