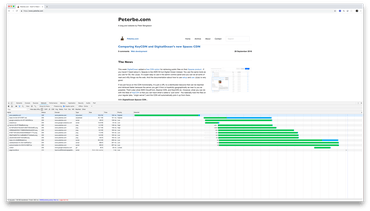
I found this in an issue discussing measuring page performance with puppeteer and it's pure gold. Especially because it's so accessible and easy to use.
Here's the code:
const puppeteer = require('puppeteer');

async function run() {
  const browser = await puppeteer.launch();
  const page = await browser.newPage();

  await page.goto('https://www.peterbe.com/');

  console.log('\n==== performance.getEntries() ====\n');
  console.log(
    await page.evaluate(() =>
      JSON.stringify(performance.getEntries(), null, '  ')
    )
  );

  console.log('\n==== performance.toJSON() ====\n');
  console.log(
    await page.evaluate(() => JSON.stringify(performance.toJSON(), null, '  '))
  );

  console.log('\n==== page.metrics() ====\n');
  const perf = await page.metrics();
  console.log(JSON.stringify(perf, null, '  '));

  browser.close();
}

run();
When you run it you get this output: https://gist.github.com/peterbe/afb09bf9277e5fa9242f8d270c687640
To run it you need to have a decently up-to-date version of puppeteer installed.
I don't claim (far from it actually!) to understand all the metrics points in there but I believe this is basically what the Network panel in the Google Chrome Dev tools is built upon. But some details and facts are easy to figure out and use in your analysis. For example, the fact that the getEntries() lists all the resources that had to be downloaded in the order they were downloaded. Also, at the end of getEntries() you get the first-paint which is often a useful metric.
Anyway, give it a spin. Wrap this up in a platform and see if you can build something really simple and really tailored to your web projects web performance testing.

Comments