Filtered by JavaScript, Python

Page 24

Reset

CSS Bloat Comparison

June 3, 2016
0 comments Web development, JavaScript

tl;dr; How much web performance negative overhead does including a CSS stylesheet (that you don't use) add to the rendering time? I don't know. But WebPagetest gives us some clues.

To jump straight to the results, check out this video which is the slow-motion rendering of 1 + 5 pages. Each page has one more big fat CSS stylesheet linked than the other. I.e. the 5th one links to 5 different .css URLs. There's also a 0th one which only loads 1 .css file which has nothing in it.

WebPagetest results
The full results are here.

I love CSS frameworks and use them ALL the time. But I'm also interested in web performance and using techniques like real-time static analysis to figure out what CSS that doesn't need to be loaded. Some of those techniques surely lead to less stuff needing to be downloaded but how big is the gain? Not sure.

So I made 6 pages that loads a CSS framework but doesn't actually use any of it. The browser will be instructed to download the file and parse it. That takes time and CPU-work will surely will have an effect on the total rendering time.

In every page, I lastly load a little piece of JavaScript just to make something appear on the page. That means, the page will not fully render until AFTER the it has loaded the .css files and one little .js file which prints something on the DOM. The reason there's a 5 second delay until it uses AJAX (fetch) to figure out their sizes is because I don't want that effect to affect the rendering on WebPagetest.

css Bytes

Noteworthy

Notice that there are two cases of "outliers". According to the measurements, bloat3.html and bloat5.html take shorter time to render compared to their smaller files (bloat2.html and bloat4.html respectively). That seems to indicate that - even though WebPagetest does 3 runs each - that "network I/O luck" plays a big role.

Also, interesting is that the first file bloat1.html which loads 118Kb more CSS than bloat0.html but clearly it doesn't seem to have a big impact.

Conclusion

It does have an effect of reduced web performance. I.e. longer loading time. The page with just 1 .css file takes 0.5 seconds and the one with 5 .css files takes 0.8 seconds. However, the results also indicate that much of the total time is spent waiting for the download. Once the browser has downloaded the payload, it appears to be very fast at parsing it to get ready to render the page accordingly. In other words, don't worry so much about the "bloat" of the content of the CSS file. Worry more about the excessive HTTP requests needed in total.

It would be interesting to inline every CSS file into the .html page and re-run. That means only the .html needs to be downloaded from the network and although the last one will be bigger when all are gzipped the difference isn't huge.

In conclusion, I'm not sure it's a huge performance loss to add big bloated CSS frameworks to your site. Most likely your big wins lie with optimizing the images and JavaScript.

UPDATE

After publishing this, I decided to inline every .css as big <style> tags. For example, bloat4.html (View source).

Here's the result.

And here's the video.

What this proves is that the difference we saw earlier was almost entirely due to "network I/O luck". All pages are gzipped. The smallest one is only 0.19Kb and the largest one is 183Kb. But there's no noticeable difference in the total time it takes to render these two. Basically, the browser's ability to parse CSS is FAST! Don't worry so much about the size of the CSS payload itself. Go forth and make pretty web pages!

hashin 0.5.0 bug fix

May 17, 2016
0 comments Python

Thank you @davehunt for finding a ugly bug in in hashin.

The bug happened when you tried to add a package that had a similar name to a package that was already in your requirements.txt. By similar name, it was if the package name was inside another name. E.g. 'selenium==' in 'pytest-selenium=='.

Here's the fix.

So make sure you upgrade to version >0.5.

Time to do concurrent CPU bound work

May 13, 2016
3 comments Python, Linux, macOS

Did you see my blog post about Decorated Concurrency - Python multiprocessing made really really easy? If not, fear not. There, I'm demonstrating how I take a task of creating 100 thumbnails from a large JPG. First in serial, then concurrently, with a library called deco. The total time to get through the work massively reduces when you do it concurrently. No surprise. But what's interesting is that each individual task takes a lot longer. Instead of 0.29 seconds per image it took 0.65 seconds per image (...inside each dedicated processor).

The simple explanation, even from a layman like myself, must be that when doing so much more, concurrently, the whole operating system struggles to keep up with other little subtle tasks.

With deco you can either let Python's multiprocessing just use as many CPUs as your computer has (8 in the case of my Macbook Pro) or you can manually set it. E.g. @concurrent(processes=5) would spread the work across a max of 5 CPUs.

So, I ran my little experiment again for every number from 1 to 8 and plotted the results:

Time elapsed vs. work time

What to take away...

The blue bars is the time it takes, in total, from starting the program till the program ends. The lower the better.

The red bars is the time it takes, in total, to complete each individual task.

Meaning, when the number of CPUs is low you have to wait longer for all the work to finish and when the number of CPUs is high the computer needs more time to finish its work. This is an insight into over-use of operating system resources.

If the work is much much more demanding than this experiment (the JPG is only 3.3Mb and one thumbnail only takes 0.3 seconds to make) you might have a red bar on the far right that is too expensive for your server. Or worse, it might break things so that everything stops.

In conclusion...

Choose wisely. Be aware how "bound" the task is.

Also, remember that if the work of each individual task is too "light", the overhead of messing with multprocessing might actually cost more than it's worth.

The code

Here's the messy code I used:


import time
from PIL import Image
from deco import concurrent, synchronized
import sys

processes = int(sys.argv[1])
assert processes >= 1
assert processes <= 8


@concurrent(processes=processes)
def slow(times, offset):
    t0 = time.time()
    path = '9745e8.jpg'
    img = Image.open(path)
    size = (100 + offset * 20, 100 + offset * 20)
    img.thumbnail(size, Image.ANTIALIAS)
    img.save('thumbnails/{}.jpg'.format(offset), 'JPEG')
    t1 = time.time()
    times[offset] = t1 - t0


@synchronized
def run(times):
    for index in range(100):
        slow(times, index)

t0 = time.time()
times = {}
run(times)
t1 = time.time()
print "TOOK", t1-t0
print "WOULD HAVE TAKEN", sum(times.values())

UPDATE

I just wanted to verify that the experiment is valid that proves that CPU bound work hogs resources acorss CPUs that affects their individual performance.

Let's try to the similar but totally different workload of a Network bound task. This time, instead of resizing JPEGs, it waits for finishing HTTP GET requests.

Network bound

So clearly it makes sense. The individual work withing each process is not generally slowed down much. A tiny bit, but not much. Also, I like the smoothness of the curve of the blue bars going from left to right. You can clearly see that it's reverse logarithmic.

Decorated Concurrency - Python multiprocessing made really really easy

May 13, 2016
17 comments Python

tl;dr There's a new interesting wrapper on Python multiprocessing called deco, written by Alex Sherman and Peter Den Hartog, both at University of Wisconsin - Madison. It makes Python multiprocessing really really easy.

The paper is here (PDF) and the code is here: https://github.com/alex-sherman/deco.

This library is based on something called Pydron which, if I understand it correctly, is still a piece of research with no code released. ("We currently estimate that we will be ready for the release in the first quarter of 2015.")

Apart from using simple decorators on functions, the big difference that deco takes, is that it makes it really easy to get started and that there's a hard restriction on how to gather the results of sub-process calls'. In deco, you pass in a mutable object that has a keyed index (e.g. a python dict). A python list is also mutable but it doesn't have an index. Meaning, you could get race conditions on mylist.append().

"However, DECO does impose one important restriction on the program: all mutations may only by index based."

Some basic example

Just look at this example:


# before.py

def slow(index):
    time.sleep(5)

def run():
    for index in list('123'):
        slow(index)
run()

And when run, you clearly expect it to take 15 seconds:

$ time python before.py

real    0m15.090s
user    0m0.057s
sys 0m0.022s

Ok, let's parallelize this with deco. First pip install deco, then:


# after.py

from deco import concurrent, synchronized

@concurrent
def slow(index):
    time.sleep(5)

@synchronized
def run():
    for index in list('123'):
        slow(index)

run()

And when run, it should be less than 15 seconds:

$ time python after.py

real    0m5.145s
user    0m0.082s
sys 0m0.038s

About the order of execution

Let's put some logging into that slow() function above.


def slow(index):
    time.sleep(5)
    print 'done with {}'.format(index)

Run the example a couple of times and note that the order is not predictable:

$ python after.py
done with 1
done with 3
done with 2
$ python after.py
done with 1
done with 2
done with 3
$ python after.py
done with 3
done with 2
done with 1

That probably don't come as a surprise for those familiar with async stuff, but it's worth reminding so you don't accidentally depend on order.

@synchronized or .wait()

Remember the run() function in the example above? The @synchronized decorator is magic. It basically figures out that within the function call there are calls out to sub-process work. What it does it that it "pauses" until all those have finished. An alternative approach is to call the .wait() method on the decorated concurrency function:


def run():
    for index in list('123'):
        slow(index)
    slow.wait()

That works the same way. This could potentially be useful if you, on the next line, need to depend on the results. But if that's the case you could just split up the function and slap a @synchronized decorator on the split-out function.

No Fire-and-forget

It might be tempting to not set the @synchronized decorator and not call .wait() hoping the work will be finished anyway somewhere in the background. The functions that are concurrent could be, for example, functions that generate thumbnails from a larger image or something time consuming where you don't care when it finishes, as long as it finishes.


# fireandforget.py
# THIS DOES NOT WORK
# And it's not expected to either.

@concurrent
def slow(index):
    time.sleep(5)

def run():
    for index in list('123'):
        slow(index)

run()

When you run it, you don't get an error:

$ time python fireandforget.py

real    0m0.231s
user    0m0.079s
sys 0m0.047s

But if you dig deeper, you'll find that it never actually executes those concurrent functions.

If you want to do fire-and-forget you need to have another service/process that actually keeps running and waiting for all work to be finished. That's how the likes of a message queue works.

Number of concurrent workers

multiprocessing.Pool automatically, as far as I can understand, figures out how many concurrent jobs it can run. On my Mac, where I have 8 CPUS, the number is 8.

This is easy to demonstrate. In the example above it does exactly 3 concurrent jobs, because len(list('123')) == 3. If I make it 8 items, the whole demo run takes, still, 5 seconds (plus a tiny amount of overhead). If I make it 9 items, it now takes 10 seconds.

How multiprocessing figures this out I don't know but I can't imagine it being anything but a standard lib OS call to ask the operating system how many CPUs it has.

You can actually override this with your own number. It looks like this:


from deco import concurrent

@concurrent(processes=5)
def really_slow_and_intensive_thing():
    ...

So that way, the operating system doesn't get too busy. It's like a throttle.

A more realistic example

Let's actually use the mutable for something and let's do something that isn't just a time.sleep(). Also, let's do something that is CPU bound. A lot of times where concurrency is useful is when you're network bound because running many network waiting things at the same time doesn't hose the system from being able to do other things.

Here's the code:


from PIL import Image
from deco import concurrent, synchronized


@concurrent
def slow(times, offset):
    t0 = time.time()
    path = '9745e8.jpg'
    img = Image.open(path)
    size = (100 + offset * 20, 100 + offset * 20)
    img.thumbnail(size, Image.ANTIALIAS)
    img.save('thumbnails/{}.jpg'.format(offset), 'JPEG')
    t1 = time.time()
    times[offset] = t1 - t0

@synchronized
def run(times):
    for index in range(100):
        slow(times, index)

t0 = time.time()
times = {}
run(times)
t1 = time.time()
print "TOOK", t1-t0
print "WOULD HAVE TAKEN", sum(times.values())

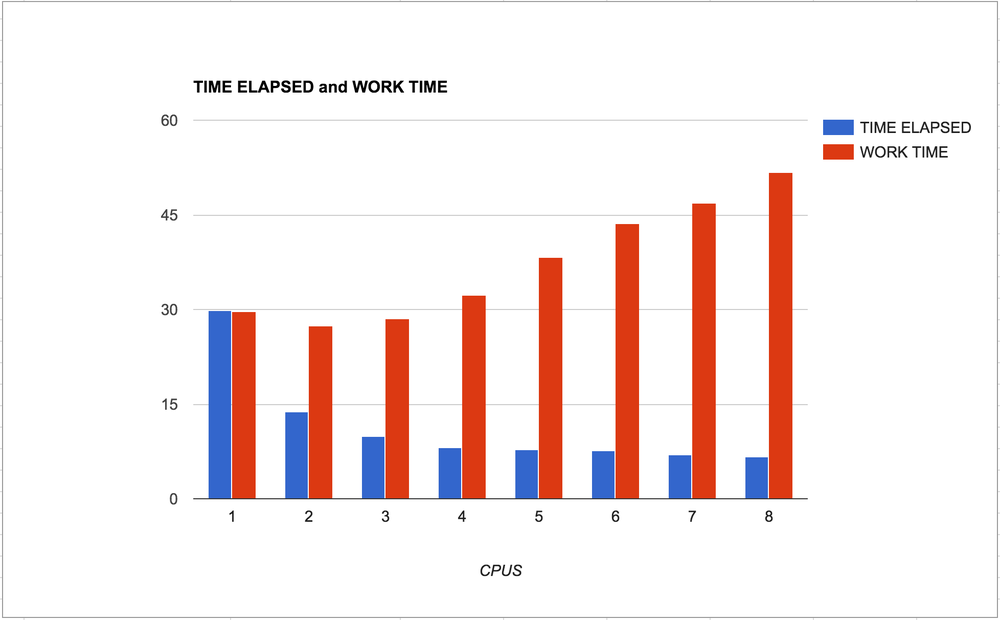
It generates 100 different thumbnails from a very large original JPG. Running this on my macbook pro takes 8.4 seconds but the individual times was a total of 65.1 seconds. The numbers makes sense, because 65 seconds / 8 cores ~= 8 seconds.

But, where it gets really interesting is that if you remove the deco decorators and run 100 thumbnail creations in serial, on my laptop, it takes 28.9 seconds. Now, 28.9 seconds is much more than 8.4 seconds so it's still a win to multiprocessing for this kind of CPU bound work. However, stampeding herd of doing 8 CPU intensive tasks at the same time can put some serious strains on your system. Also, it could cause high spikes in terms of memory allocation that wouldn't have happened if freed space can be re-used in the serial pattern.

Here's by the way the difference in what this looks like in the Activity Monitor:

Fully concurrent PIL work

Running PIL in all CPUs

Same work but in serial

In serial

One more "realistic" pattern

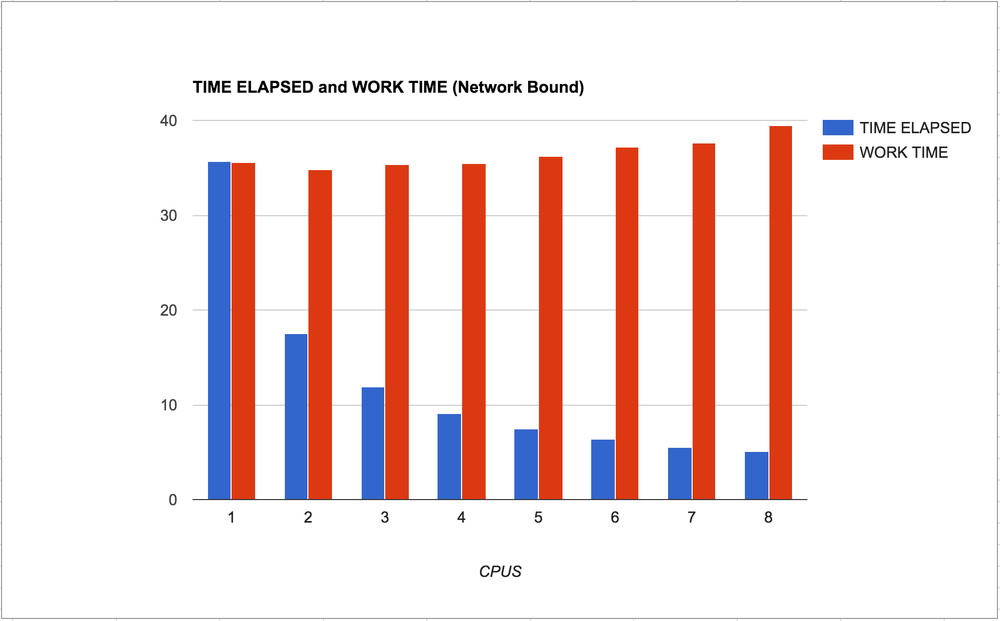
Let's do this again with a network bound task. Let's download 100 webpages from my blog. We'll do this by keeping an index where the URL is the key and the value is the time it took to download that one individual URL. This time, let's start with the serial pattern:

(Note! I ran these two experiments a couple of times so that the server-side cache would get a chance to clear out outliers)


import time, requests

urls = """
https://www.peterbe.com/plog/blogitem-040212-1
https://www.peterbe.com/plog/geopy-distance-calculation-pitfall
https://www.peterbe.com/plog/app-for-figuring-out-the-best-car-for-you
https://www.peterbe.com/plog/Mvbackupfiles
...a bunch more...
https://www.peterbe.com/plog/swedish-holidays-explaine
https://www.peterbe.com/plog/wing-ide-versus-jed
https://www.peterbe.com/plog/worst-flash-site-of-the-year-2010
""".strip().splitlines()
assert len(urls) == 100

def download(url, data):
    t0 = time.time()
    assert requests.get(url).status_code == 200
    t1 = time.time()
    data[url] = t1-t0

def run(data):
    for url in urls:
        download(url, data)

somemute = {}
t0 = time.time()
run(somemute)
t1 = time.time()
print "TOOK", t1-t0
print "WOULD HAVE TAKEN", sum(somemute.values()), "seconds"

When run, the output is:

TOOK 35.3457410336
WOULD HAVE TAKEN 35.3454759121 seconds

Now, let's add the deco decorators, so basically these changes:

from deco import concurrent, synchronized

@concurrent
def download(url, data):
    t0 = time.time()
    assert requests.get(url).status_code == 200
    t1 = time.time()
    data[url] = t1-t0

@synchronized
def run(data):
    for url in urls:
        download(url, data)

And the output this time:

TOOK 5.13103795052
WOULD HAVE TAKEN 39.7795288563 seconds

So, instead of it having to take 39.8 seconds it only needed to take 5 seconds with extremely little modification. I call that a win!

What's next

Easy; actually build something that uses this.

gg - A prototype to rule Git, GitHub and Bugzilla

May 6, 2016
0 comments Python, Web development

tl;dr; I'm starting a new "side-project". (I say side-project in quotation marks because I'm doing this for the sake of work ultimately). It's call gg and it's a command line program for doing various tasks to do with git, GitHub and Bugzilla.

Many years ago I noticed certain patterns of things I do. Usually work starts with a Bugzilla bug. I then need to make a new branch with the bug number in the branch name and when I'm done I need to push that branch to my fork and create a GitHub Pull Request. When it's been merged (or if I merge it manually myself) I have to go back to the master branch, fetch the upstream, delete the now merged branch and delete the remove branch. All of these things are tedious so I wrapped up my patterns in a little Python project called bgg, so I can do:

$ G start 123456789  # that's a bugzilla ID
# edit files and save
$ G commit
# now I wait for the Pull Request to be merged
$ G getback
# all things get cleaned up and I'm back on the master branch

This new project, gg, is a complete re-write of bgg but with some big changes:

  1. It's based on Click
  2. All sub-commands are separate projects with their own GitHub repo and PyPI submissions
  3. Instead of wrapping git commands in a subprocess, it uses GitPython.
  4. Audacious goals of major feature upgrades such as automatic bug/issue assignment, ability to see rebased branches and automatic Pull Request creation, etc.
  5. Audacious goal of documenting everything and succeed in getting other people to write their own plugins and share what they make. Or at least, make it easy to write your own plugin.

So far, I've only written 1 plugin. It's called gg-start. All it does is it creates branches for you. For example, you can type:

$ gg start https://github.com/org/repo/issues/1234
# or...
$ gg start https://bugzilla.mozilla.org/show_bug.cgi?id=123456789
# or...
$ gg start

And it figures out a good branch name, remembers the issue title and checks out the new branch. All that stuff is saved in ~/.gg.json so that when you later (and this plugin hasn't been built yet) type gg commit it can use that title to automatically suggest a good git commit message and it should know where to push it and start the GitHub Pull Request etc.

My intention is to first get decent parity with bgg. So I'll need to create plugins called gg-commit, gg-branches, gg-rebase, gg-getback, gg-cleanup, gg-tag, gg-merge and gg-push. Once parity is achieved I'm going to add some more fancy features and work hard on making it clear how you can write your own plugin.

Wish me luck!

How to track Google Analytics pageviews on non-web requests (with Python)

May 3, 2016
1 comment Python, Web development, Django, Mozilla

tl;dr; Use raven's ThreadedRequestsHTTPTransport transport class to send Google Analytics pageview trackings asynchronously to Google Analytics to collect pageviews that aren't actually browser pages.

We have an API on our Django site that was not designed from the ground up. We had a bunch of internal endpoints that were used by the website. So we simply exposed those as API endpoints that anybody can query. All we did was wrap certain parts carefully as to not expose private stuff and we wrote a simple web page where you can see a list of all the endpoints and what parameters are needed. Later we added auth-by-token.

Now the problem we have is that we don't know which endpoints people use and, as equally important, which ones people don't use. If we had more stats we'd be able to confidently deprecate some (for easier maintanenace) and optimize some (to avoid resource overuse).

Our first attempt was to use statsd to collect metrics and display those with graphite. But it just didn't work out. There are just too many different "keys". Basically, each endpoint (aka URL, aka URI) is a key. And if you include the query string parameters, the number of keys just gets nuts. Statsd and graphite is better when you have about as many keys as you have fingers on one hand. For example, HTTP error codes, 200, 302, 400, 404 and 500.

Also, we already use Google Analytics to track pageviews on our website, which is basically a measure of how many people render web pages that have HTML and JavaScript. Google Analytic's UI is great and powerful. I'm sure other competing tools like Mixpanel, Piwik, Gauges, etc are great too, but Google Analytics is reliable, likely to stick around and something many people are familiar with.

So how do you simulate pageviews when you don't have JavaScript rendering? The answer; using plain HTTP POST. (HTTPS of course). And how do you prevent blocking on sending analytics without making your users have to wait? By doing it asynchronously. Either by threading or a background working message queue.

Threading or a message queue

If you have a message queue configured and confident in its running, you should probably use that. But it adds a certain element of complexity. It makes your stack more complex because now you need to maintain a consumer(s) and the central message queue thing itself. What if you don't have a message queue all set up? Use Python threading.

To do the threading, which is hard, it's always a good idea to try to stand on the shoulder of giants. Or, if you can't find a giant, find something that is mature and proven to work well over time. We found that in Raven.

Raven is the Python library, or "agent", used for Sentry, the open source error tracking software. As you can tell by the name, Raven tries to be quite agnostic of Sentry the server component. Inside it, it has a couple of good libraries for making threaded jobs whose task is to make web requests. In particuarly, the awesome ThreadedRequestsHTTPTransport. Using it basically looks like this:


import urlparse
from raven.transport.threaded_requests import ThreadedRequestsHTTPTransport

transporter = ThreadedRequestsHTTPTransport(
    urlparse.urlparse('https://ssl.google-analytics.com/collect'),
    timeout=5
)

params = {
    ...more about this later...
}

def success_cb():
    print "Yay!"

def failure_cb(exception):
    print "Boo :("

transporter.async_send(
    params,
    headers,
    success_cb,
    failure_cb
)

The call isn't very different from regular plain old requests.post.

About the parameters

This is probably the most exciting part and the place where you need some thought. It's non-trivial because you might need to put some careful thought into what you want to track.

Your friends is: This documentation page

There's also the Hit Builder tool where you can check that the values you are going to send make sense.

Some of the basic ones are easy:

"Protocol Version"

Just set to v=1

"Tracking ID"

That code thing you see in the regular chunk of JavaScript you put in the head, e.g tid=UA-1234-Z

"Data Source"

Optional word you call this type of traffic. We went with ds=api because we use it to measure the web API.

The user ones are a bit more tricky. Basically because you don't want to accidentally leak potentially sensitive information. We decided to keep this highly anonymized.

"Client ID"

A random UUID (version 4) number that identifies the user or the app. Not to be confused with "User ID" which is basically a string that identifies the user's session storage ID or something. Since in our case we don't have a user (unless they use an API token) we leave this to a new random UUID each time. E.g. cid=uuid.uuid4().hex This field is not optional.

"User ID"

Some string that identifies the user but doesn't reveal anything about the user. For example, we use the PostgreSQL primary key ID of the user as a string. It just means we can know if the same user make several API requests but we can never know who that user is. Google Analytics uses it to "lump" requests together. This field is optional.

Next we need to pass information about the hit and the "content". This is important. Especially the "Hit type" because this is where you make your manually server-side tracking act as if the user had clicked around on the website with a browser.

"Hit type"

Set this to t=pageview and it'll show up Google Analytics as if the user had just navigated to the URL in her browser. It's kinda weird to do this because clearly the user hasn't. Most likely she's used curl or something from the command line. So it's not really a pageview but, on our end, we have "views" in the webserver that produce information to the user. Some of it is HTML and some of it is JSON, in terms of output format, but either way they're sending us a URL and we respond with data.

"Document location URL"

The full absolute URL of that was used. E.g. https://www.example.com/page?foo=bar. So in our Django app we set this to dl=request.build_absolute_uri(). If you have a site where you might have multiple domains in use but want to collect them all under just 1 specific domain you need to set dh=example.com.

"Document Host Name" and "Document Path"

I actually don't know what the point of this is if you've already set the "Document location URL".

"Document Title"

In Google Analytics you can view your Content Drilldown by title instead of by URL path. In our case we set this to a string we know from the internal Python class that is used to make the API endpoint. dt='API (%s)'%api_model.__class__.__name__.

There are many more things you can set, such as the clients IP, the user agent, timings, exceptions. We chose to NOT include the user's IP. If people using the JavaScript version of Google Analytics can set their browser to NOT include the IP, we should respect that. Also, it's rarely interesting to see where the requests for a web API because it's often servers' curl or requests that makes the query, not the human.

Sample implementation

Going back to the code example mentioned above, let's demonstrate a fuller example:


import urlparse
from raven.transport.threaded_requests import ThreadedRequestsHTTPTransport

transporter = ThreadedRequestsHTTPTransport(
    urlparse.urlparse('https://ssl.google-analytics.com/collect'),
    timeout=5
)

# Remember, this is a Django, but you get the idea

domain = settings.GOOGLE_ANALYTICS_DOMAIN
if not domain or domain == 'auto':
    domain = RequestSite(request).domain

params = {
    'v': 1,
    'tid': settings.GOOGLE_ANALYTICS_ID,
    'dh': domain,
    't': 'pageview,
    'ds': 'api',
    'cid': uuid.uuid4().hext,
    'dp': request.path,
    'dl': request.build_request_uri(),
    'dt': 'API ({})'.format(model_class.__class__.__name__),
    'ua': request.META.get('HTTP_USER_AGENT'),
}

def success_cb():
    logger.info('Successfully informed Google Analytics (%s)', params)

def failure_cb(exception):
    logger.exception(exception)

transporter.async_send(
    params,
    headers,
    success_cb,
    failure_cb
)

How to unit test this

The class we're using, ThreadedRequestsHTTPTransport has, as you might have seen, a method called async_send. There's also one, with the exact same signature, called sync_send which does the same thing but in a blocking fashion. So you could make your code look someting silly like this:


def send_tracking(page_title, request, async=True):
    # ...same as example above but wrapped in a function...
    function = async and transporter.async_send or transporter.sync_send
    function(
        params,
        headers,
        success_cb,
        failure_cb
    )

And then in your tests you pass in async=False instead.
But don't do that. The code shouldn't be sub-serviant to the tests (unless it's for the sake of splitting up monster-long functions).
Instead, I recommend you mock the inner workings of that ThreadedRequestsHTTPTransport class so you can make the whole operation synchronous. For example...


import mock
from django.test import TestCase
from django.test.client import RequestFactory

from where.you.have import pageview_tracking


class TestTracking(TestCase):

    @mock.patch('raven.transport.threaded_requests.AsyncWorker')
    @mock.patch('requests.post')
    def test_pageview_tracking(self, rpost, aw):

        def mocked_queue(function, data, headers, success_cb, failure_cb):
            function(data, headers, success_cb, failure_cb)

        aw().queue.side_effect = mocked_queue

        request = RequestFactory().get('/some/page')
        with self.settings(GOOGLE_ANALYTICS_ID='XYZ-123'):
            pageview_tracking('Test page', request)

            # Now we can assert that 'requests.post' was called.
            # Left as an exercise to the reader :)
            print rpost.mock_calls       

This is synchronous now and works great. It's not finished. You might want to write a side effect for the requests.post so you can have better control of that post. That'll also give you a chance to potentially NOT return a 200 OK and make sure that your failure_cb callback function gets called.

How to manually test this

One thing I was very curious about when I started was to see how it worked if you really ran this for reals but without polluting your real Google Analytics account. For that I built a second little web server on the side, whose address I used instead of https://ssl.google-analytics.com/collect. So, change your code so that https://ssl.google-analytics.com/collect is not hardcoded but a variable you can change locally. Change it to http://localhost:5000/ and start this little Flask server:


import time
import random
from flask import Flask, abort, request

app = Flask(__name__)
app.debug = True

@app.route("/", methods=['GET', 'POST'])
def hello():
    print "- " * 40
    print request.method, request.path
    print "ARGS:", request.args
    print "FORM:", request.form
    print "DATA:", repr(request.data)
    if request.args.get('sleep'):
        sec = int(request.args['sleep'])
        print "** Sleeping for", sec, "seconds"
        time.sleep(sec)
        print "** Done sleeping."
    if random.randint(1, 5) == 1:
        abort(500)
    elif random.randint(1, 5) == 1:
        # really get it stuck now
        time.sleep(20)
    return "OK"

if __name__ == "__main__":
    app.run()

Now you get an insight into what gets posted and you can pretend that it's slow to respond. Also, you can get an insight into how your app behaves when this collection destination throws a 5xx error.

How to really test it

Google Analytics is tricky to test in that they collect all the stuff they collect then they take their time to process it and it then shows up the next day as stats. But, there's a hack! You can go into your Google Analytics account and click "Real-Time" -> "Overview" and you should see hits coming in as you're testing this. Obviously you don't want to do this on your real production account, but perhaps you have a stage/dev instance you can use. Or, just be patient :)

Don't that this or bind

April 12, 2016
2 comments JavaScript

Wrong

Having to create a variable outside the nested scope so that when you refer to this you refer to the parent's scope.


var Increaser = function(amount) {
  this.amount = amount;
};
Increaser.prototype.add = function(value) {
  if (Array.isArray(value)) {
    var that = this;  // NOTE!
    return value.map(function(item) {
      return item + that.amount;
    }); 
  } else {
    return value + this.amount;
  }
};

var inc = new Increaser(2);

console.log(inc.add(10)); // 12
console.log(inc.add([1, 2, 3])); // [3, 4, 5]

On CodePen

Why it's bad. Because it's code smell. Meaning, it's a hack that goes against what's natural. Also, because it's not necessary. There is a better solution. Hold tight. Code smells have a tendency to get worse. In this case we only have 1 function with its own scope so we can allow ourselves to call it just "that". If it was more complex, we'd have to call it "first_this" or "outer_that" or something ugly.

It's a cheap solution and it works but the risk is that the code becomes hard for humans to debug once it grows in scope.

Also Wrong But Better


var Increaser = function(amount) {
  this.amount = amount;
};
Increaser.prototype.add = function(value) {
  if (Array.isArray(value)) {
   return value.map(function(item) {
     return item + this.amount;
   }.bind(this));  // NOTE!
  } else {
    return value + this.amount;
  }
};

var inc = new Increaser(2);

console.log(inc.add(10)); // 12
console.log(inc.add([1, 2, 3])); // [3, 4, 5]

On CodePend

Why it's bad. Using .bind() creates a new function. It might not matter in this scenario but asking the JavaScript engine to create yet another function object in memory might matter in terms of optimization.

Why it's better. Because you "fix things" before it gets worse. This way, when deep inside the nested scope you don't need to juggle the name of what the this has temporarily been re-bound to.

Righter

The map function takes a second argument that is the context. This is true for forEach, filter and find too.


var Increaser = function(amount) {
  this.amount = amount;
};
Increaser.prototype.add = function(value) {
  if (Array.isArray(value)) {
   return value.map(function(item) {
     return item + this.amount;
   }, this);  // NOTE!
  } else {
    return value + this.amount;
  }
};

var inc = new Increaser(2);

console.log(inc.add(10)); // 12
console.log(inc.add([1, 2, 3])); // [3, 4, 5]

Why it's better.

No new assignment of a variable. No need to bind, which means it doesn't create a new function. And it's built-in.

Much Righter

Switch to ES6! Then you can use fat arrow functions.


class Increaser {
  constructor(amount) {
    this.amount = amount;
  }
  add(value) {
    if (Array.isArray(value)) {
      return value.map(item => {
        return item + this.amount;
      }); 
    } else {
      return value + this.amount;
    }
  }
}

let inc = new Increaser(2);

console.log(inc.add(10)); // 12
console.log(inc.add([1, 2, 3])); // [3, 4, 5]

On CodePen

Why it's better: Because then the whole problem goes away. Fat arrow functions are functions that have no scope of their own. Just like if statements. (EDIT: That's an over simplification. They do have their own scope. Just no own arguments or own this)

4 different kinds of React component styles

April 7, 2016
4 comments JavaScript, React

I know I'm going to be laughed at for having misunderstood the latest React lingo and best practice. But guess, what I don't give a ...

I'm starting to like React more and more. There's a certain element of confidence about them since they only do what you ask them to do and even though there's state involved, if you do things right it feels like it's only one direction that state "flows". And events also only flow in one direction (backwards, sort of).

However, an ugly wart with React is the angle of it being hard to learn. All powerful things are hard to learn but it's certainly not made easier when there are multiple ways to do the same thing. What I'm referring to is how to write components.

Partly as a way of me learning and summorizing what I've come to understand and partly to jot it down so others can be helped by the same summary. Others who are in a similar situation as I am with learning React.

The default Component Class

This is what I grew up learning. This is code you most likely start with and then realize, there is no need for state here.


class Button extends React.Component {

  static propTypes = {
    day: PropTypes.string.isRequired,
    increment: PropTypes.func.isRequired,
  }

  render() {
    return (
      <div>
        <button onClick={this.props.increment}>Today is {this.props.day}</button>
      </div>
    )
  }
}

The old style createClass component

I believe this is what you used before you had ES6 so readily available. And I heard a rumor from Facebook that this is going to be deprecated. Strange rumor considering that createClass is still used in the main documentation.


const Button = React.createClass({
  propTypes: {
    day: PropTypes.string.isRequired,
    increment: PropTypes.func.isRequired,
  },

  render: function() {
    return (
      <div>
        <button onClick={this.props.increment}>Today is {this.props.day}</button>
      </div>
    )
  }
})

The Stateless Function component

Makes it possible to do some JavaScript right there before the return


const Button = ({
  day,
  increment
}) => {
  return (
    <div>
      <button onClick={increment}>Today is {day}</button>
    </div>
  )
}

Button.propTypes = {
  day: PropTypes.string.isRequired,
  increment: PropTypes.func.isRequired,
}

The Presentational Component

An ES6 shortcut trick whereby you express a onliner lambda function as if it's got a body of its own.


const Button = ({
  day,
  increment
}) => (
  <div>
    <button onClick={increment}>Today is {day}</button>
  </div>
)

Button.propTypes = {
  day: PropTypes.string.isRequired,
  increment: PropTypes.func.isRequired,
}

Some thoughts and reactions

  • The advantage with the class is that you can write a shouldComponentUpdate hook method. That's applicable when you have an intimate knowledge of the props and state and you might know that deep inside the props or the state, there's differences you don't need to consider different enough to warrent a re-render of the component. Arguably, if you're in that rabbit hole and need some optimization hack like that, perhaps it's time to break things up.

  • The Stateless Function pattern and the Presentational Component are both functions. Here's what they look like converted to ES5: One and Two. Basically no difference.

  • The Stateless Function and the Presentational Component both suffer from the ugliness of that propTypes guard hanging outside the code. That makes it the opposite of encapsulated/bundled. You have to remember to copy two things.

  • A lot of smarter-than-me-people seem to indicate that classes in JavaScript is a bad thing and I haven't personally understood that argument yet. What I do know is that I kinda like the bundling. You have the whole component in a little package under one name and inside you can put little helper functions/methods that support the render function. Also, having a state in one of those classes is optional. Just because a component doesn't need state, doesn't mean you have to use a functional component. Also, the class is great for putting in side-effects in the componentWillMount and cancel side-effects in componentWillUnmount.

  • Supposedly with React.createClass() you can use mixins, but I've never used that. Is mixins something that's rapidly going out of fashion? I think I need to go back and properly read Mixins Are Dead. Long Live Composition.

  • Boy I wish there was only one way to do things and only one single name. In Django you used to only have view functions. Then class-based views came along and the diversion caused a lot of strain, anger and confusion. "Why should I use which?! I hate change!" was a common noise. However, JavaScript is what it is and React is newfangled stuff.

  • I kinda like the "statement" you make when you write a stateless/presentational function component. Just by seeing its signature you can tell that it won't mess with state inside. But if your needs grow over time and you realize you need a bit of state solely for that component, you have to rewrite it entirely, right?

  • I love plainly writing down the props I need as argument and not have to write this.props.myPropthing. Makes it easy to debug what the code does.

  • Is there not a way to put that Button.propTypes thing in the first React.Component style into the class?? UPDATE There is! Thanks Emiliano for showing me how.

  • If you're prepared to remember more terminology; the class component style is called a Container Component. I like that name!

Please Please Share your thoughts and reactions and I'll try to collect it and incorporate it into this blog post.

Whatsdeployed on only one site

February 26, 2016
0 comments Python, Web development, Mozilla

Last year I developed a web app called "Whatsdeployed". It's one of those rare one-afternoon-hacks that turns out to be really really useful. I use it every [work]day. And I've heard many people say they use it too.

At the time I built it, it only supported comparing multiple instance. E.g. a production and a dev site. Or a test, stage and production. But oftentimes, especially for smaller projects, you might only just have your one deployed site.

So I've now made it possible so you can compare just 1 site against your github.com master branch.

For example: whatsdeployed.io/s-Sir

Or whatsdeployed.io/s-J14

What these do, is simply comparing what git sha revision is deployed on those side-projects, compared to the latest git sha on the master branch on github.com.

How to no-mincss links with django-pipeline

February 3, 2016
2 comments Python, Web development, Django

This might be the kind of problem only I have, but I thought I'd share in case others are in a similar pickle.

Warming Up

First of all, the way my personal site works is that every rendered page gets cached as rendered HTML. Midway, storing the rendered page in the cache, an optimization transformation happens. It basically takes HTML like this:


<html>
<link rel="stylesheet" href="vendor.css">
<link rel="stylesheet" href="stuff.css">
<body>...</body>
</html>

into this:


<html>
<style>
/* optimized contents of vendor.css and stuff.css minified */
</style>
<body>...</body>
</html>

Just right-click and "View Page Source" and you'll see.

When it does this it also filters out CSS selectors in those .css files that aren't actually used in the rendered HTML. This makes the inlined CSS much smaller. Especially since so much of the CSS comes from a CSS framework.

However, there are certain .css files that have references to selectors that aren't in the generated HTML but are needed later when some JavaScript changes the DOM based on AJAX or user actions. For example, the CSS used by the Autocompeter widget. The program that does this CSS optimization transformation is called mincss and it has a feature where you can tell it to NOT bother with certain CSS selectors (using a CSS comment) or certain <link> tags entirely. It looks like this:


<link rel="stylesheet" href="ajaxstuff.css" data-mincss="no">

Where Does django-pipeline Come In?

So, setting that data-mincss="no" isn't easy when you use django-pipeline because you don't write <link ... in your Django templates, you write {% stylesheet 'name-of-bundle %}. So, how do you get it in?

Well, first let's define the bundle. In my case it looks like this:


PIPELINE_CSS = {
  ...
  # Bundle of CSS that strictly isn't needed at pure HTML render-time
  'base_dynamic': {
        'source_filenames': (
            'css/transition.css',
            'autocompeter/autocompeter.min.css',
        ),
        'extra_context': {
            'no_mincss': True,
        },
        'output_filename': 'css/base-dynamic.min.css',
    },
    ...
}

But that isn't enough. Next, I need to override how django-pipeline turn that block into a <link ...> tag. To do that, you need to create a directory and file called pipeline/css.html (or pipeline/css.jinja if you use Jinja rendering by default).

So take the default one from inside the pipeline package and copy it into your project into one of your apps's templates directory. For example, in my case, peterbecom/apps/base/templates/pipeline/css.jinja. Then, in that template add at the very end somehting like this:

{% if no_mincss %} data-mincss="no"{% endif %} />

The Point?

The point is that if you're in a similar situation where you want django-pipeline to output the <link> or <script> tag differently than it's capable of, by default, then this is a good example of that.